Introductory Data Science using R
Lecture 1: The Data Science Framework
Admin
- Content available at https://haziqj.ml/teaching
- 4 x 2hr lectures
- 10min break on the hour
- Ask questions as we go along
Structure
- Lecture 1: The data science framework
- Lecture 2: Using
R - Lecture 3: Data science with
R - Lecture 4: Exploratory analysis of Kiva.org data
The scientific inquiry
data + model —> understand
- Not new, arises in many fields
- Natural sciences
- Econometrics
- Psychology
- Sociology
- etc.

Giuseppe Piazzi’s observations in the Monatliche Correspondenz, September 1801.

- Design of experiments; randomised control trials.
- Sir Ronald Fisher (1890–1962).

Data is now available by happenstance, and not just collected by design.
Big Data
The more we measure, the more we don’t understand
- Breadth vs depth paradox; Big p Small n; The curse of dimensionality
- “Data first” paradigm
- Ethics; privacy
define: Data Science
The “concept to unify statistics, data analysis, machine learning and their related methods” in order to “understand and analyze actual phenomena” with data.
- Multi-displinary field
- Goal: extract knowledge and insights from structured and unstructured data

Examples of Data Science problems
Real-world problems from the Alan Turing Institute
- Real-time jammer detection, identification and localization in 3G and 4G networks
- Automated matching of businesses to government contract opportunities
- Using real-world data to advance air traffic control
- Personalised lung cancer treatment modelling using electronic health records and genomics
Examples of Data Science problems
Real-world problems from the Alan Turing Institute
- Identify potential drivers of engaging in extremism
- News feed analysis to help understand global instability
- Improved strength training using smart gym equipment data

Scope: Exploratory
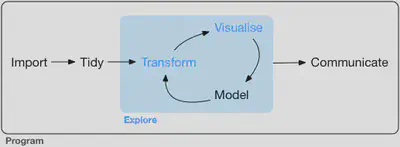
- Focus on transform and visualise
- Modelling requires a specific skill set (Stats or ML)
- GOAL: Generate many promising leads that you can later explore in more depth
Machine Learning vs Statistics
Statistics aims to turn humans into robots.
- Concept of “statistical proof”
- Often interest is inference
Machine learning aims to turn robots into humans.
- Make sense of patterns from big data
- Often interest is prediction
Data Quality and Readiness
There’s a sea of data, but most of it is undrinkable

Data neglect: data cleaning is tedious and complex
80-20 rule of Data Science
- Most time is spent cleaning up data
- Affectionally called data “wrangling”
- [TBA] Data Readiness levels (Bands A, B and C)
Types of data
- Structured data
- Data is in a nicely organised repository
- E.g. Tables, matrices, etc.
- Unstructured data
- Information does not have a predefined data model
- E.g. images, colours, text, sound, etc.
Types of data
- Continuous data
- Measurements are taken on a continuous scale e.g. height, weight, temperature, GDP, distance, etc.
- Usually arises from physical experiments
- Discrete data
- Measurements which can only take certain values e.g. sex, survey responses (Likert scales), occupation, ratings, ranks, etc.
- Usually arises in social sciences
Types of data
| Treatment | Continuous Data | Categorical Data |
|---|---|---|
| Import class | numeric | factor, ordinal |
| Visualise | Histograms, density plots, scatter plot, box & whisker plot, pie charts | Bar plots, |
| Summarise | 5-point summaries | Frequency tables |
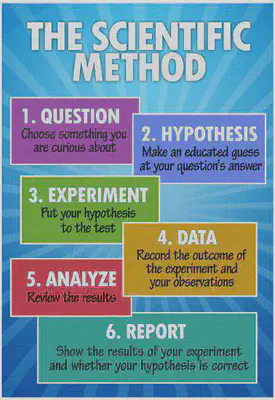
Exploratory Data Analysis
Generate questions about your data.
Search for answers by visualising, transforming, and modelling your data.
Use what you learn to refine your questions and/or generate new questions.
Modelling
$$y_i = \alpha + \beta x_i + \epsilon_i$$ $$\epsilon_i \sim \text{N}(0,\sigma^2)$$
- EDA does not help in providing statistical proof, nor give predictions
- To do this, engage in statistical or ML models
- Many types of models, depending on what question you want answered
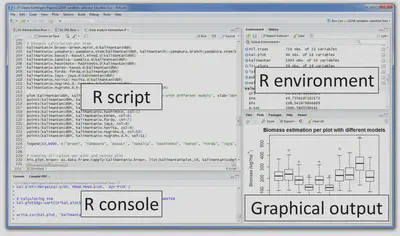
The R programming language
R is a language and environment for statistical computing and graphics https://www.r-project.org/about.html
- It is free and open source
- Runs everywhere
- Supports extensions
- Engaging community
- Links to other languages
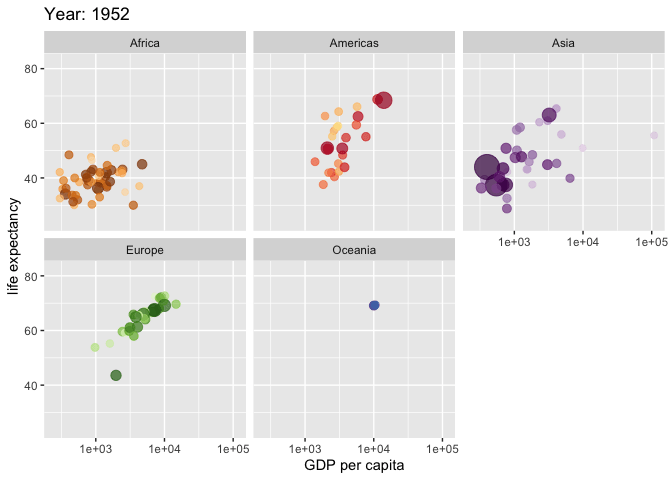
ggplot2 in R
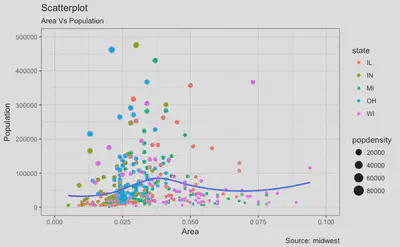
ggplot2 in R
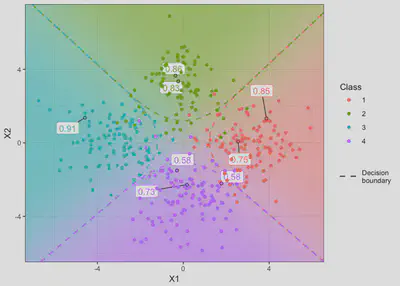
ggplot2 in R
Kiva.org data set
https://www.kaggle.com/kiva/data-science-for-good-kiva-crowdfunding#kiva_loans.csv
Exercise
- What exploratory analyses would you conduct on this data set?
- What other data do you need to supplement your analyses?
- What questions do you aim to answer?
End of Lecture 1
Questions?
Supplementary material
Inference vs Prediction

Source: datascienceblog.com
Model interpretability
- Model interpretability is necessary for inference
- In a nutshell, a model is interpretable if we can “see” how the model generates its estimates
- c.f. Blackboxes
- Interpretable models often uses simplified assumptions
Model complexity
- A complex model is often better at prediction tasks
- “More parameters to tune”
- However, model interpretability suffers
Bias-Variance tradeoff

$$ E[f(x) - \hat f (x)]^2 = \text{Bias}^2[\hat f(x)] + \text{Var}[\hat f(x)] + \sigma^2 $$
Linear regression

Economic freedom = 2.6 + 0.6 Trade
Neural networks

Source: towardsdatascience.com
Survey Methodology

Source: Groves et al. (2009)
Three populations

Sampling design for BSA survey
- Target: Adults aged 18 or over in GB
- Survey: Private households south of the Caledonian Canal
- Frame: Addresses in the Postcode address file
Multistage design:
- Stratify by postcode sectors
- Simple random sampling of addresses
- Simple random sampling of individuals
From 60mil people, obtained 3,297 respondents in final sample.
See also
Data Readiness
- Band C: Hearsday data. Is it really available? Has it actually been recorded? Format: PDF, log books, etc.
- Band B: Ready for exploratory analysis, visualisations. Missing values, anomalies, …
- Band A: Ready for ML/Stats models.