| Characteristic | Overall N = 2,0001 |
Belait N = 3031 |
Brunei-Muara N = 1,4531 |
Temburong N = 251 |
Tutong N = 2191 |
p-value2 |
|---|---|---|---|---|---|---|
| Gender | 0.2 | |||||
| Male | 990 (50%) | 161 (53%) | 702 (48%) | 16 (64%) | 111 (51%) | |
| Female | 1,010 (51%) | 142 (47%) | 751 (52%) | 9 (36%) | 108 (49%) | |
| Age | 39 (29, 47) | 39 (29, 47) | 39 (30, 48) | 42 (29, 48) | 38 (29, 47) | 0.7 |
| Education | 0.5 | |||||
| Primary School | 38 (1.9%) | 11 (3.6%) | 22 (1.5%) | 1 (4.0%) | 4 (1.8%) | |
| Lower Secondary | 145 (7.3%) | 20 (6.6%) | 98 (6.7%) | 2 (8.0%) | 25 (11%) | |
| O Level | 422 (21%) | 68 (22%) | 298 (21%) | 4 (16%) | 52 (24%) | |
| A Level | 141 (7.1%) | 23 (7.6%) | 103 (7.1%) | 1 (4.0%) | 14 (6.4%) | |
| National Certificate | 59 (3.0%) | 6 (2.0%) | 47 (3.2%) | 1 (4.0%) | 5 (2.3%) | |
| Diploma | 52 (2.6%) | 8 (2.6%) | 37 (2.5%) | 1 (4.0%) | 6 (2.7%) | |
| National Diploma | 193 (9.7%) | 23 (7.6%) | 152 (10%) | 3 (12%) | 15 (6.8%) | |
| Higher National Diploma | 247 (12%) | 36 (12%) | 176 (12%) | 6 (24%) | 29 (13%) | |
| Bachelor Degree | 501 (25%) | 74 (24%) | 375 (26%) | 4 (16%) | 48 (22%) | |
| Master Degree | 185 (9.3%) | 33 (11%) | 131 (9.0%) | 2 (8.0%) | 19 (8.7%) | |
| PhD | 17 (0.9%) | 1 (0.3%) | 14 (1.0%) | 0 (0%) | 2 (0.9%) | |
| 1 n (%); Median (Q1, Q3) | ||||||
| 2 Pearson’s Chi-squared test; Kruskal-Wallis rank sum test; Fisher’s Exact Test for Count Data with simulated p-value (based on 2000 replicates) | ||||||
Brunei ICT Usage and Expenditure Survey Report
This is a sample report based on artificially generated data solely for training and educational purposes. It should not be used to draw real-world inferences or policy decisions.
Introduction
The Brunei Darussalam ICT Usage and Expenditure Survey 2024 was conducted to understand the current landscape of information and communications technology (ICT) usage, focusing particularly on broadband internet usage and associated expenditure patterns among households across the country. This survey provides insights essential for policymaking, infrastructure improvement, and targeted ICT development initiatives.
Specifically, the objectives of the survey were:
- To identify broadband and data usage patterns across different demographic groups.
- To analyze monthly ICT expenditure and its relationship to usage.
- To evaluate spatial distribution and variability in ICT access and affordability.
Demography
This section provides an overview of the demographic characteristics of respondents who participated in the survey. The survey sampled a total of 2,000 respondents across four districts in Brunei Darussalam, comprising Belait (N=303), Brunei-Muara (N=1,453), Temburong (N=25), and Tutong (N=219).
Overall, there was a balanced gender distribution with 990 (50%) male and 1,010 (51%) female respondents. The proportions were consistent across districts, though notably, Temburong had a higher proportion of male respondents (64%) compared to other districts, but this difference was not statistically significant (p = 0.2).
The median age of respondents was 39 years, with an interquartile range (IQR) from 29 to 47 years. Age distribution showed minimal variability across districts, with median ages ranging between 38 and 42 years (p = 0.7).
Respondents represented a diverse range of educational backgrounds. The largest group had attained a Bachelor’s degree (25%), followed by O Level qualifications (21%) and Higher National Diploma holders (12%). Other notable categories included National Diploma holders (9.7%), Master Degree holders (9.3%), and lower educational categories such as Lower Secondary (7.3%) and A Level (7.1%). Distribution across districts was relatively consistent, with minor differences not reaching statistical significance (p = 0.5).
This demographic snapshot indicates a representative and varied sample suitable for further analyses related to ICT usage and expenditure patterns.
Analysis of Survey Data
ICT Usage Patterns
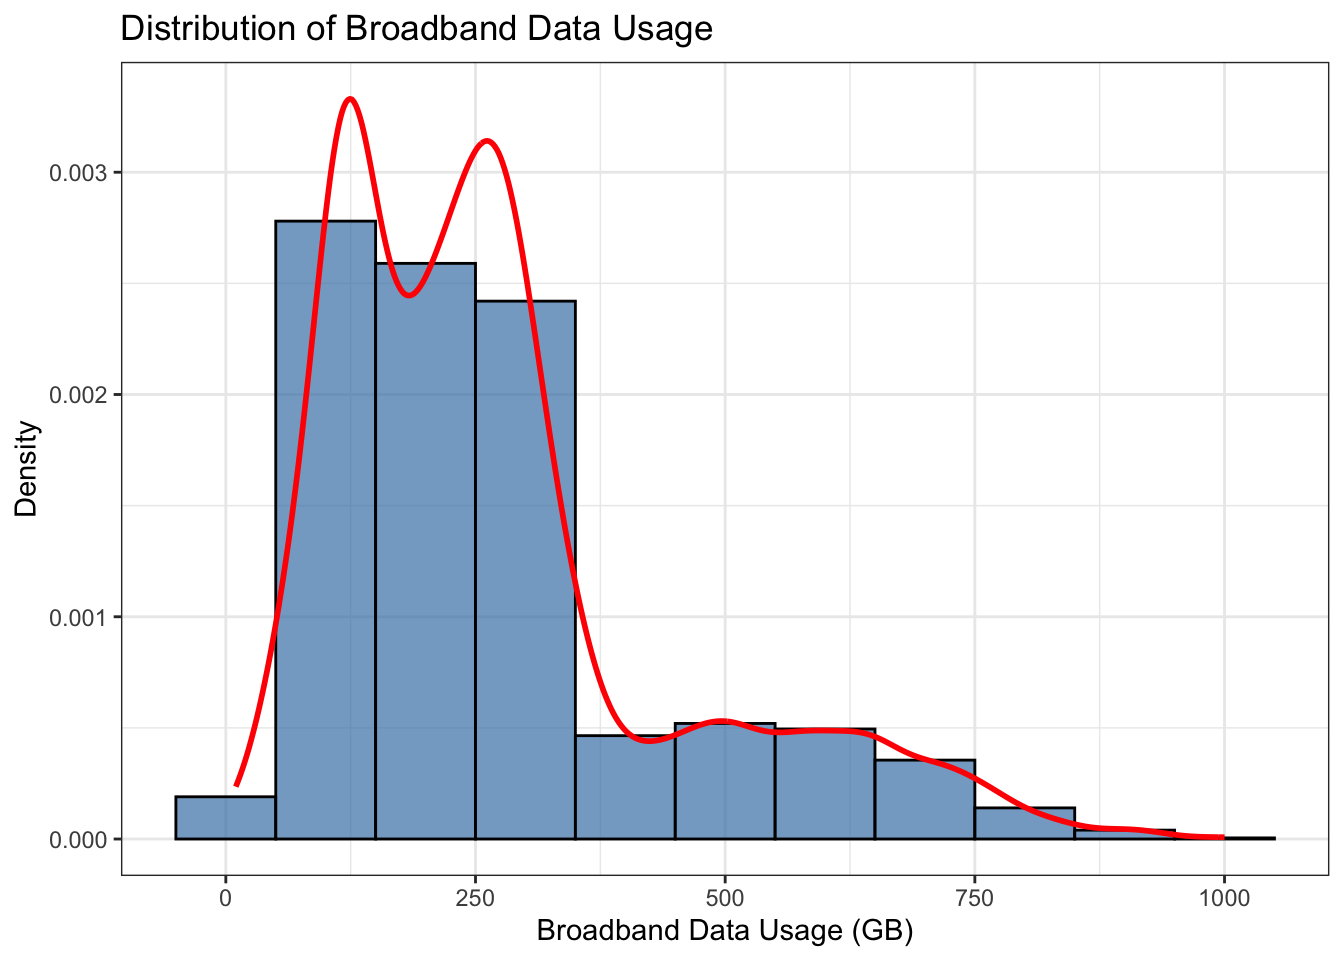
Analysis reveals distinct patterns of broadband data usage among households in Brunei Darussalam. The distribution of broadband data usage (Figure 1) among survey respondents illustrates a clear right-skewed pattern, indicating most households consume moderate levels of data, typically ranging between approximately 150 GB and 500 GB monthly. The density curve reveals two prominent peaks, suggesting two common usage behaviors or subscription plans among respondents. The first peak around 200 GB likely corresponds to standard or moderate internet use, while the second peak near 400 GB may reflect heavier streaming, gaming, or multi-user household behaviors. There is a noticeable tail extending towards high data consumption levels (up to 1000 GB), though fewer households fall into this extreme usage category. This distribution highlights varied consumer behaviors and supports targeted broadband package planning and policy considerations.
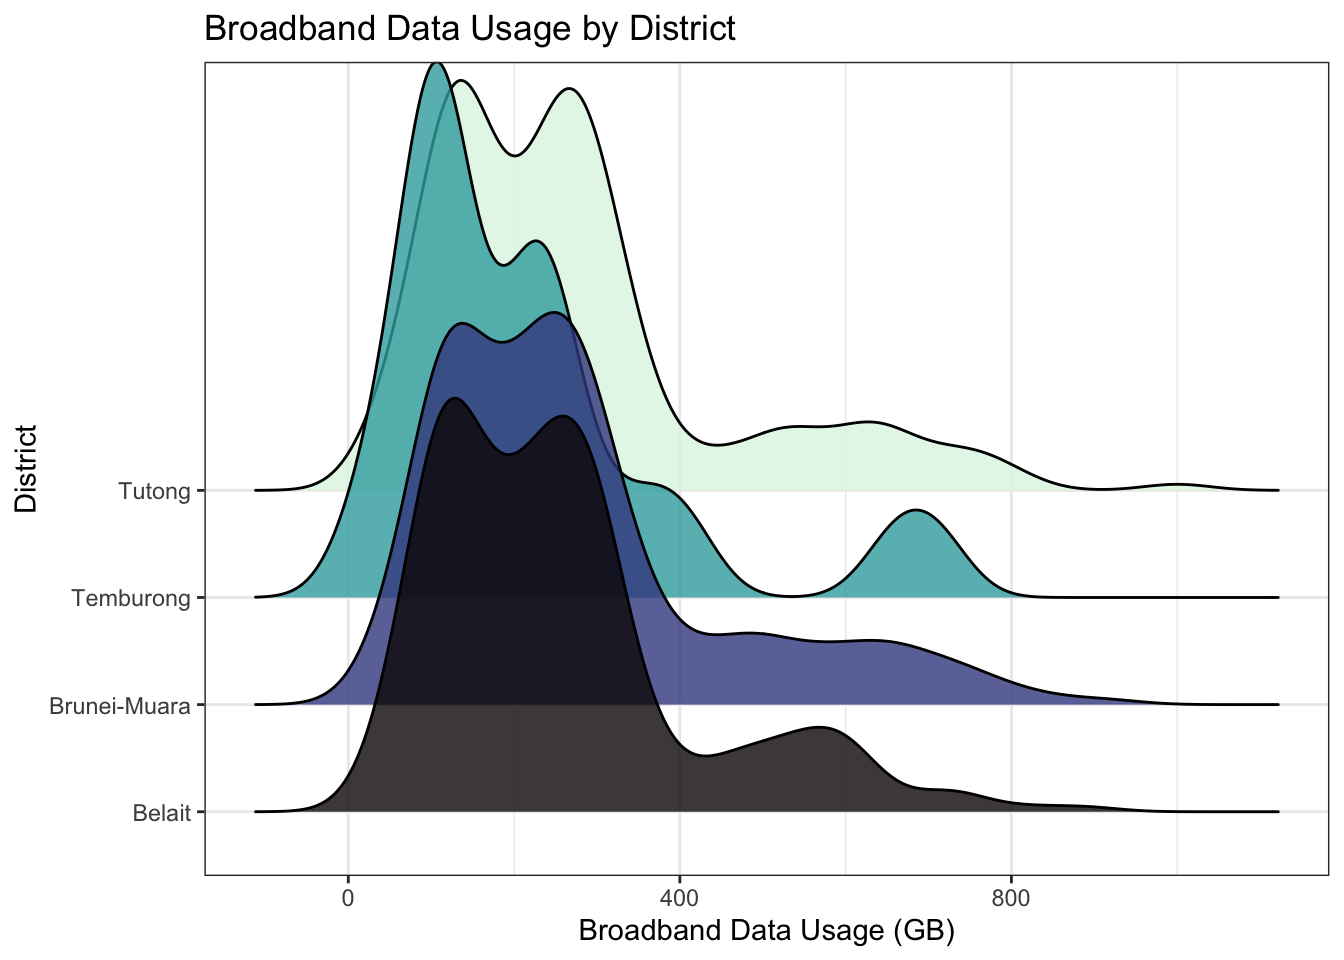
The broadband data usage across Brunei Darussalam demonstrates distinct district-level patterns. The Brunei-Muara and Belait districts exhibit similar usage distributions, characterized by prominent peaks around moderate usage levels (approximately 200-400 GB), suggesting typical household internet usage behaviors. Conversely, Tutong district shows broader variability with multiple peaks, indicating more diverse data consumption behaviors, possibly due to varied demographic and socioeconomic characteristics. Notably, Temburong exhibits lower overall data usage with distinct peaks at lower levels, reflecting limited broadband infrastructure or differing consumption preferences. Understanding these district-level differences is crucial for addressing regional disparities in broadband provision and optimizing ICT development strategies across Brunei.
Monthly ICT Expenditure
| Statistic | Expenditure (BND) |
|---|---|
| Min | 3.00 |
| Max | 782.00 |
| Mean | 114.09 |
| Median | 100.50 |
| Standard Deviation | 66.03 |
The survey also assessed monthly expenditure related to broadband and ICT services. Table 2 indicates significant variation in household spending. Monthly expenditure ranges widely from a minimum of BND 3 to a maximum of BND 782, demonstrating diverse financial commitments toward ICT services. The average monthly expenditure stands at BND 114.09, while the median expenditure of BND 100.50 indicates that half of the surveyed households spend approximately BND 100 or less monthly. The standard deviation of BND 66.03 further underscores the considerable variability in ICT expenditure, suggesting differences in consumer choices, service types, or broadband package affordability among households.
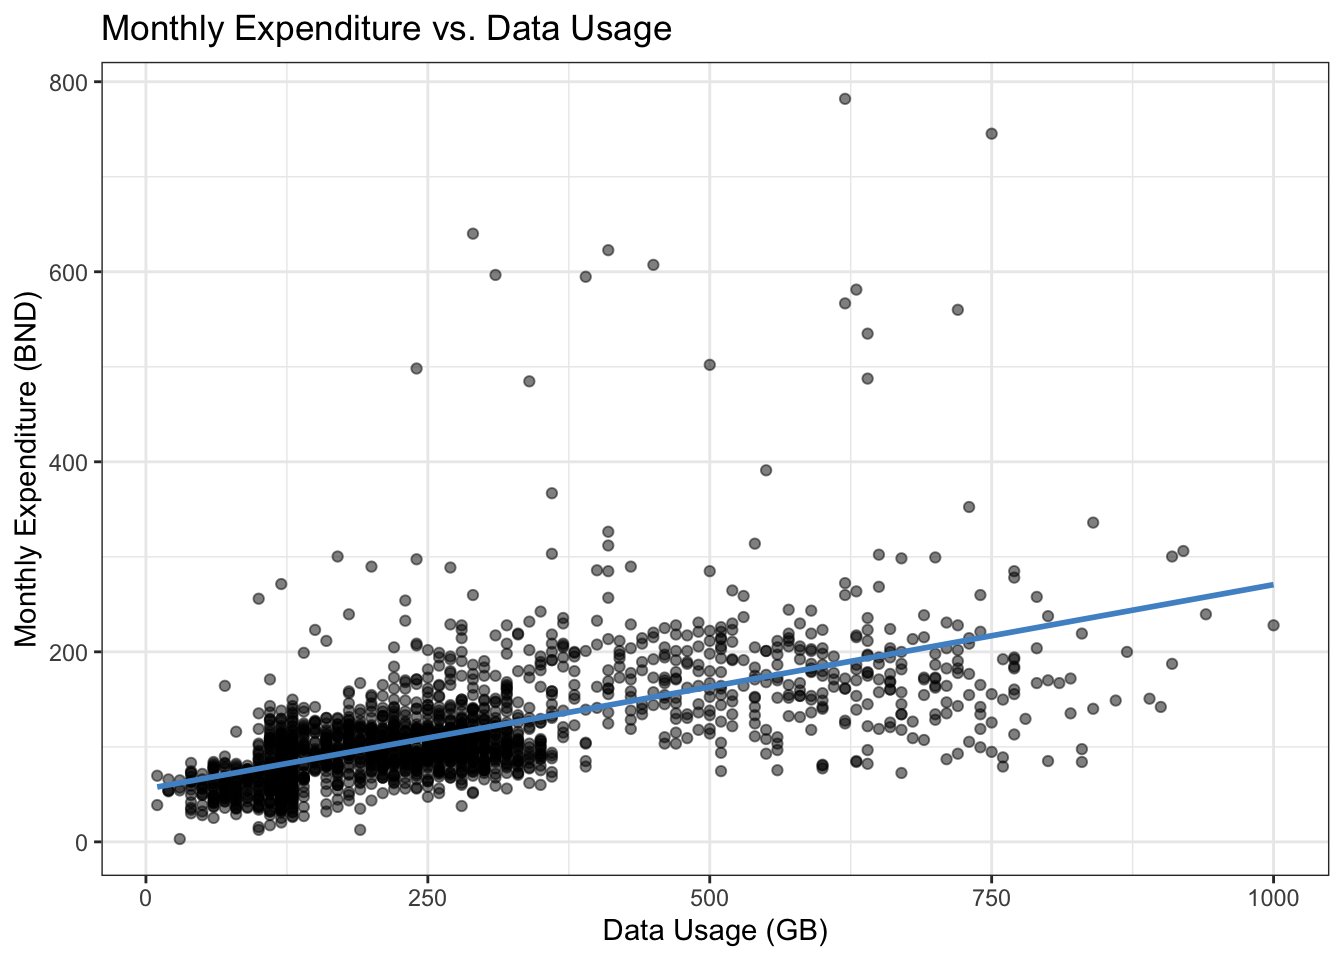
The scatter plot in Figure 3 illustrates a positive relationship (\(\rho=0.57\)) between broadband data usage and monthly ICT expenditure, suggesting that households consuming more data generally incur higher expenses. This trend aligns logically with the pricing structures of broadband service providers, where higher data packages or unlimited plans typically attract increased subscription fees. However, the wide dispersion around the trend line indicates considerable variability—some households manage high data usage at relatively lower costs, possibly due to efficient data plans or bundled service offers. Conversely, a subset of households pays significantly higher amounts for similar data usage levels, which may reflect subscription to premium services, additional value-added features, or the lack of awareness of cost-effective options. This insight underscores the importance of consumer education and policy interventions aimed at promoting transparent pricing and competitive broadband packages.
Expenditure Patterns by Education Level
Education levels were recategorized for analysis purposes. Differences in ICT spending habits across education levels provide insights into how demographic factors influence ICT affordability and access.
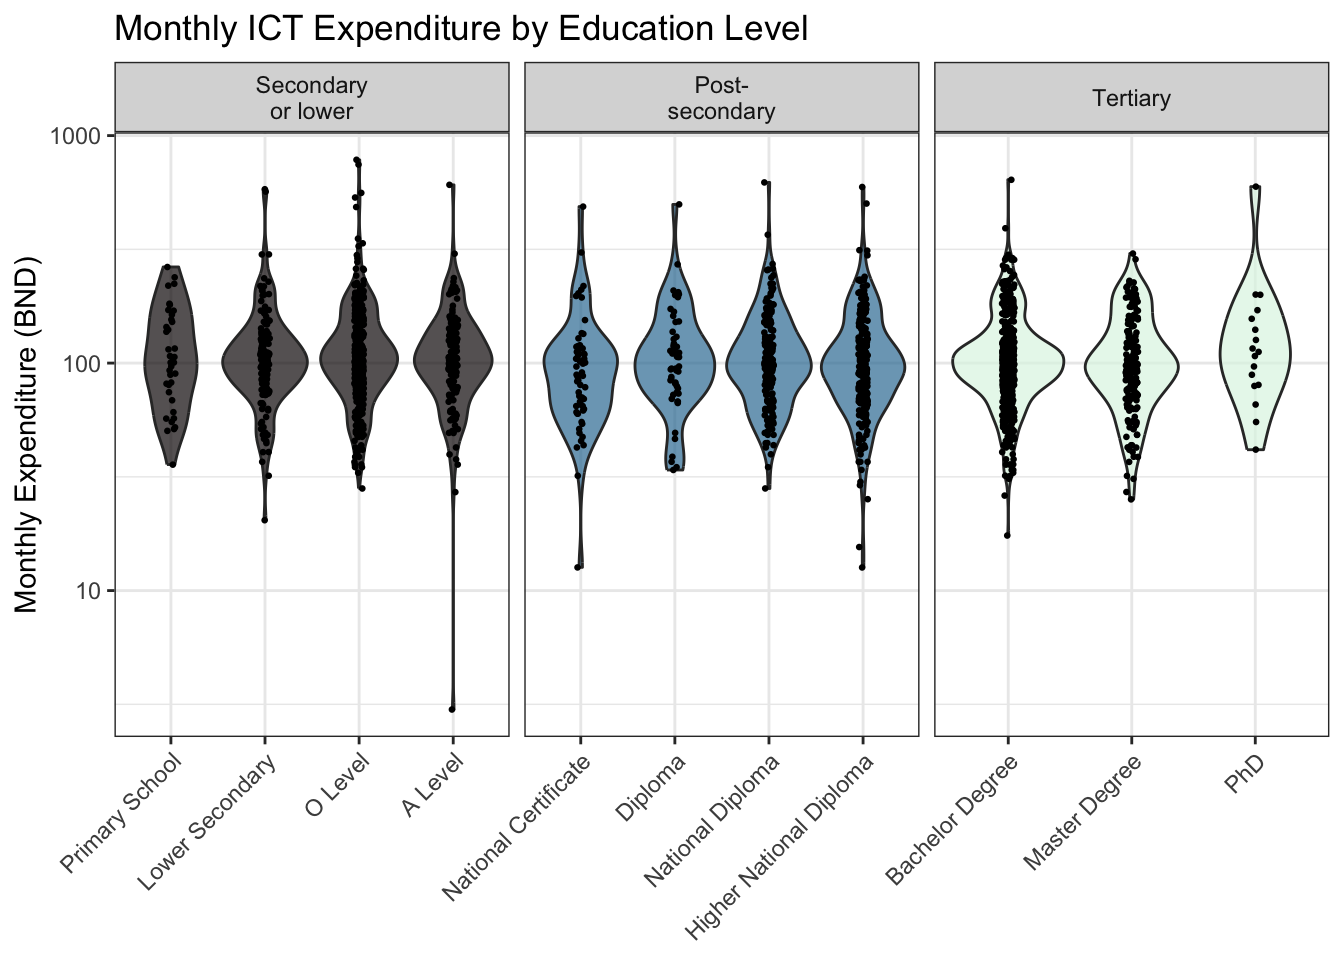
As seen in Figure 4, monthly ICT expenditure varies noticeably across education levels, categorized broadly into secondary or lower, post-secondary, and tertiary groups. Generally, higher education groups, particularly those with tertiary qualifications (Bachelor’s degree and above), show slightly elevated median expenditures compared to lower education categories. The distribution among tertiary-educated respondents is also wider, indicating greater variability in spending, likely reflecting higher disposable income or more diverse usage needs. Conversely, respondents with secondary education or lower tend toward relatively lower and more consistent expenditures, suggesting more uniform ICT service preferences or financial constraints. These insights underscore the importance of educational background as a factor influencing ICT spending behaviors.
Spatial Variability of ICT Expenditure
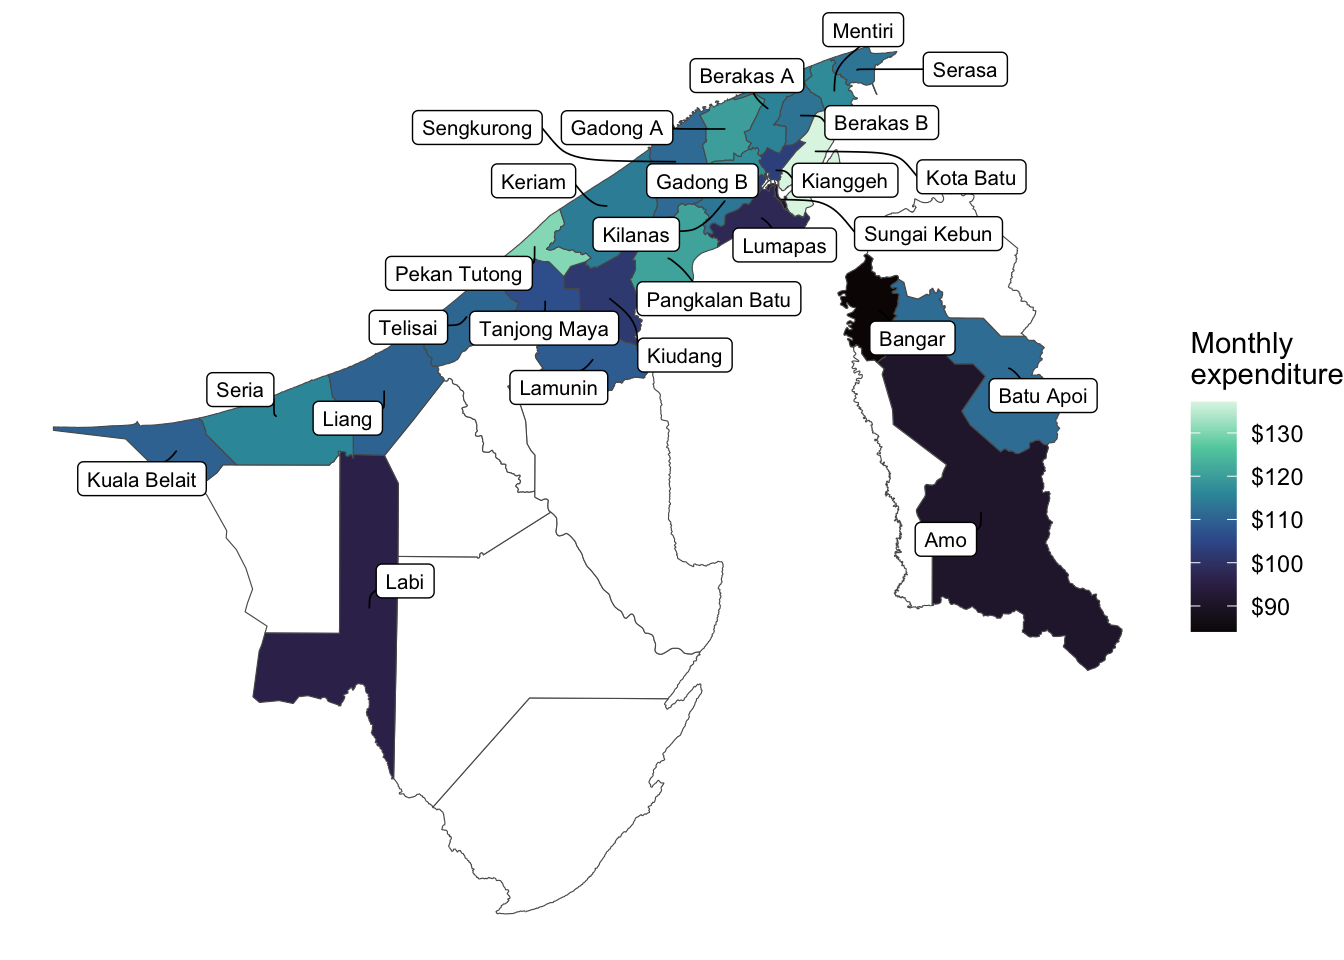
Geographic location has significant implications for broadband affordability and spending patterns. From Figure 5, the highest expenditures are predominantly concentrated in the Brunei-Muara district, notably in the Kota Batu area, reflecting higher broadband subscription rates, possibly linked to higher income levels or greater access to premium ICT services in urbanized and central regions. Pekan Tutong also shows relatively elevated ICT spending. Conversely, rural and less densely populated areas such as Temburong district and Mukim Labi in Belait district exhibit notably lower expenditures, potentially indicating limited broadband infrastructure availability or lower purchasing power. These spatial differences highlight the necessity for targeted policy interventions to address broadband affordability and service accessibility in underserved rural regions.
Conclusion
The Brunei ICT Usage and Expenditure Survey 2024 highlights critical differences in ICT usage and expenditure across demographic groups and geographic regions. Findings indicate targeted interventions could effectively address disparities and enhance broadband accessibility and affordability nationwide.
Future surveys should continue monitoring these trends, informing evidence-based policy decisions, and optimizing resource allocation for national ICT development.
