A simulation study was carried out to investigate the performance of the proposed limited information goodness-of-fit tests. The data was generated using an underlying variable framework. The true parameter values were
- Loadings:
- Factor correlations: (1 factor) or (2 factors)
- Thresholds:
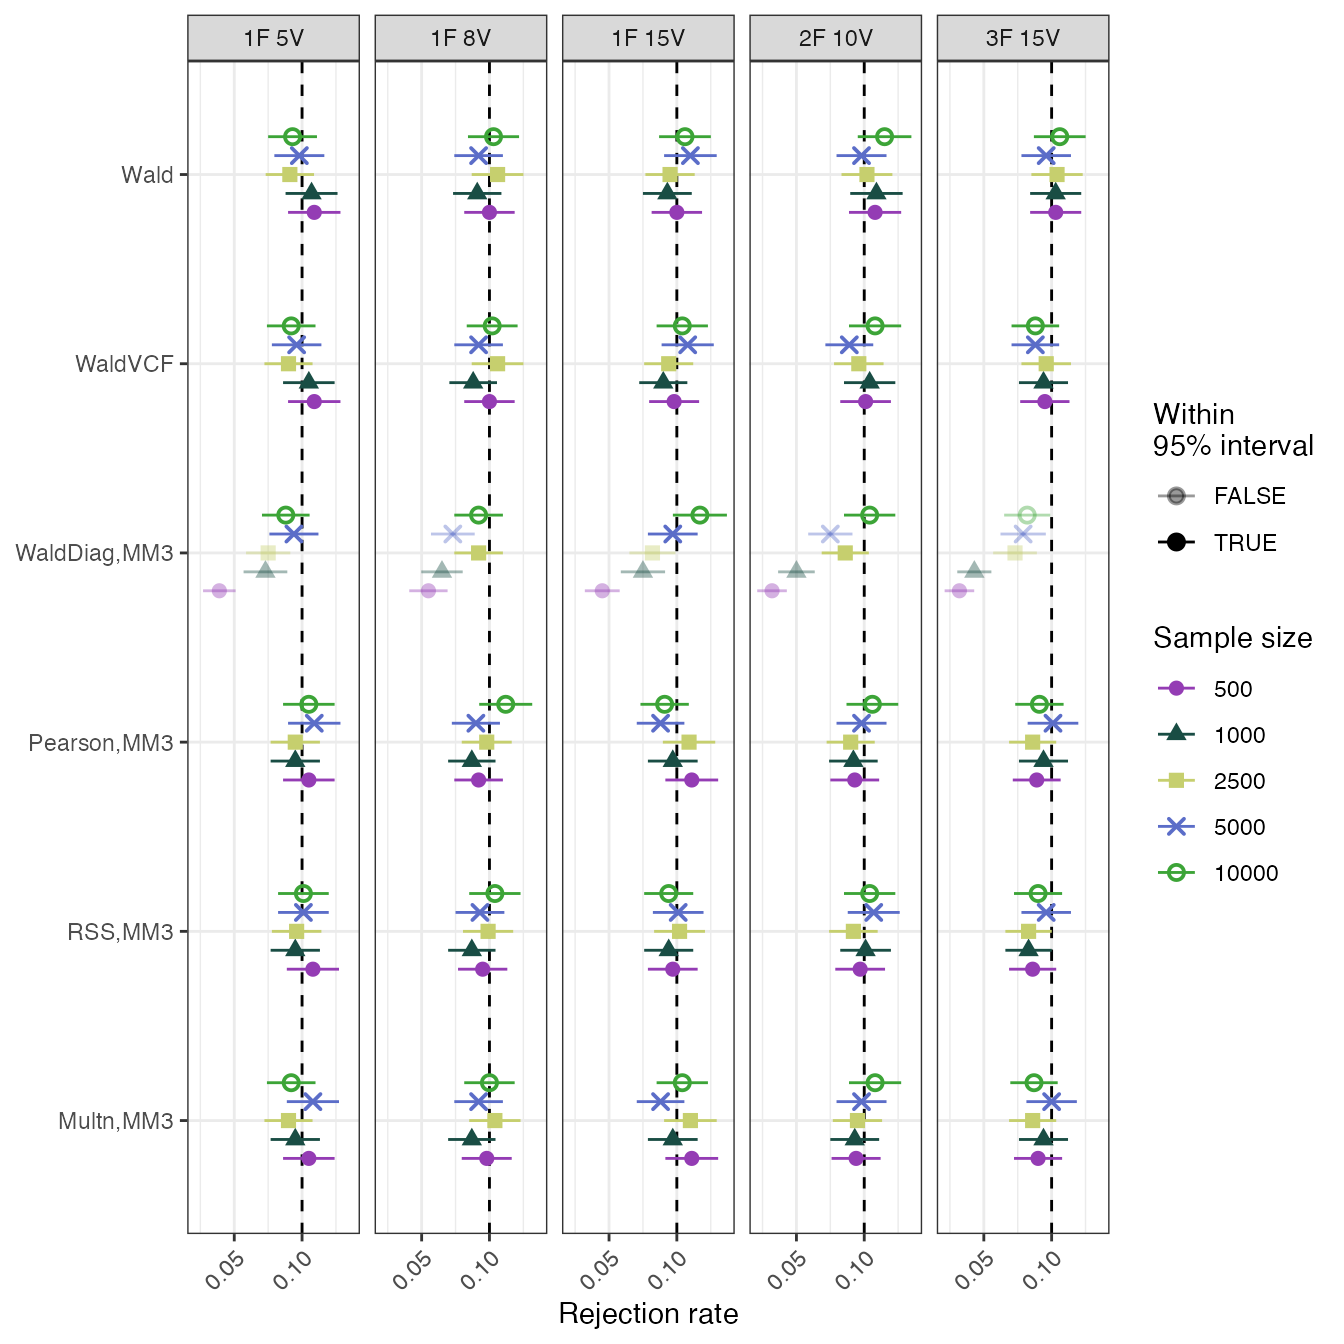
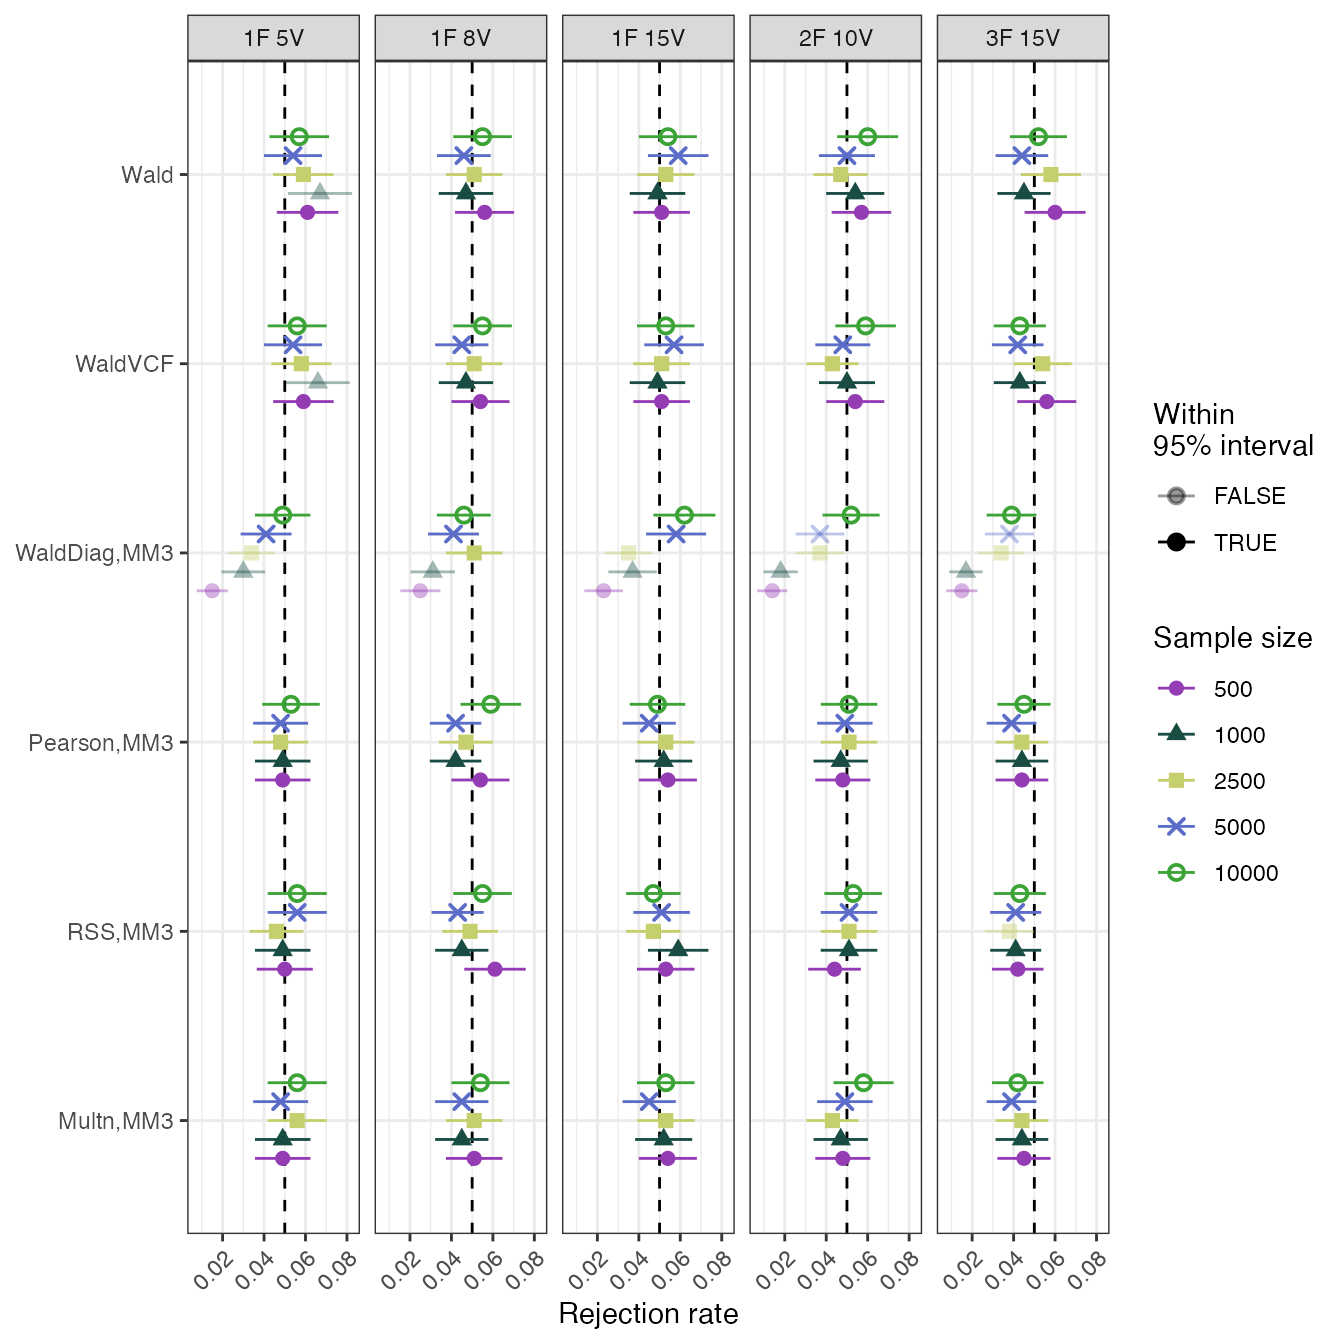
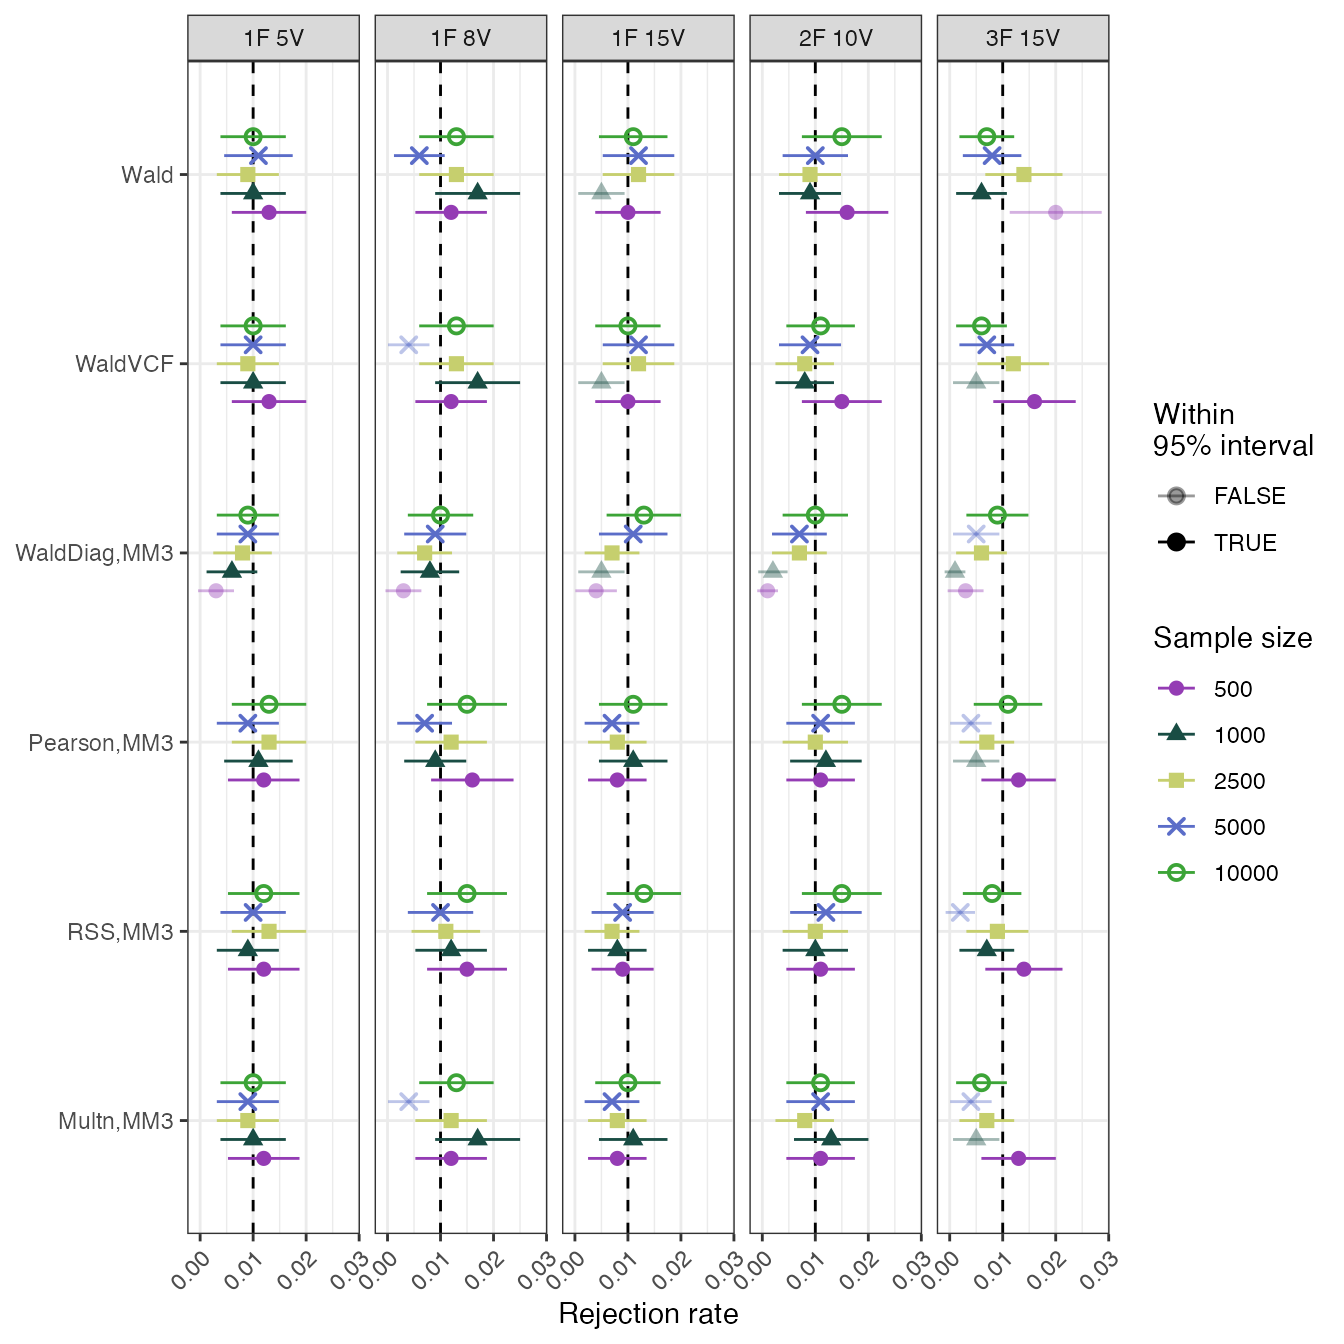
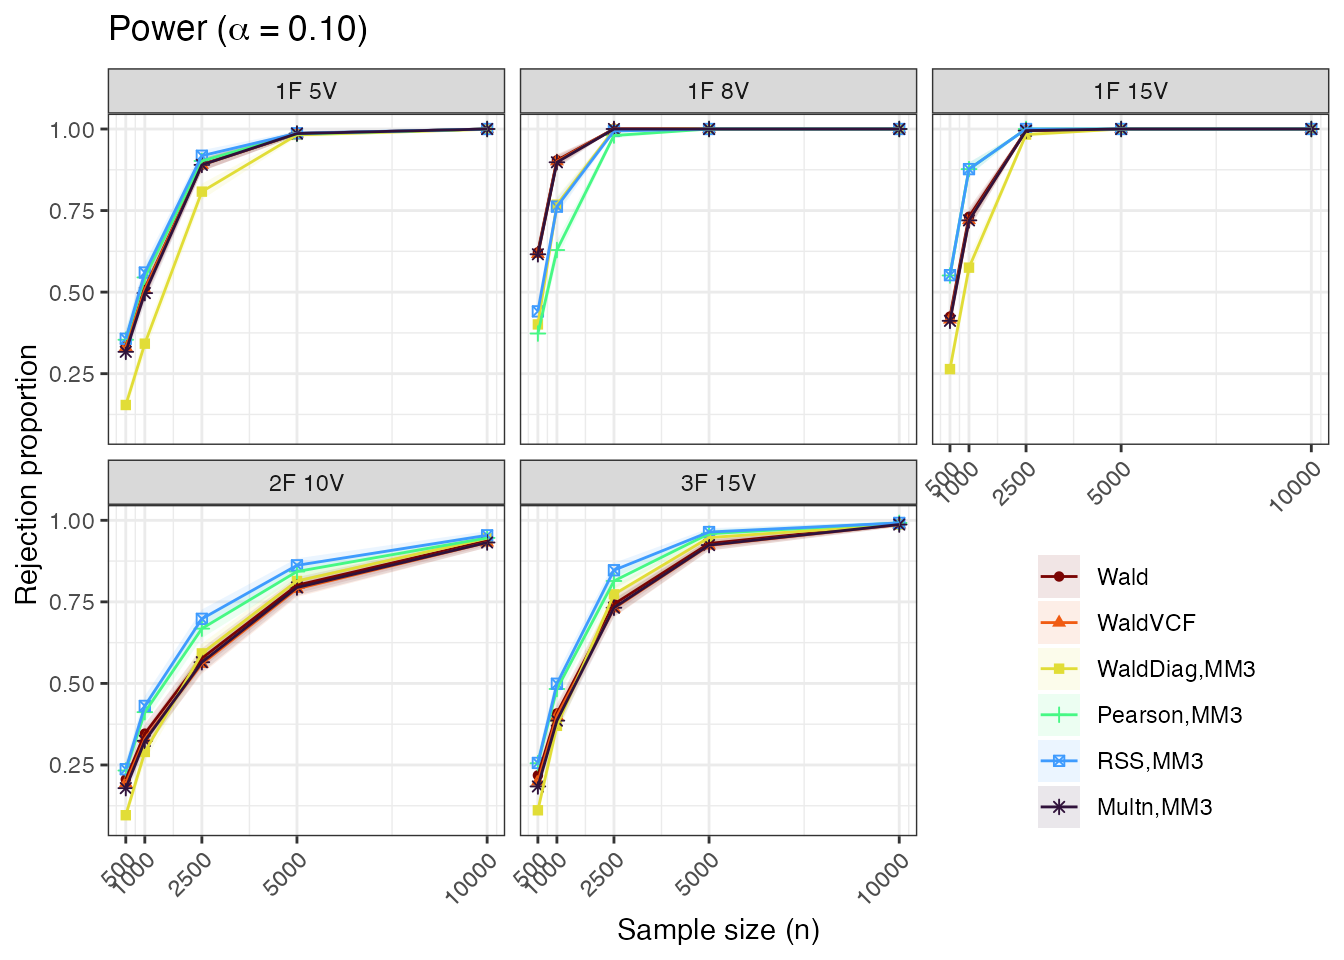
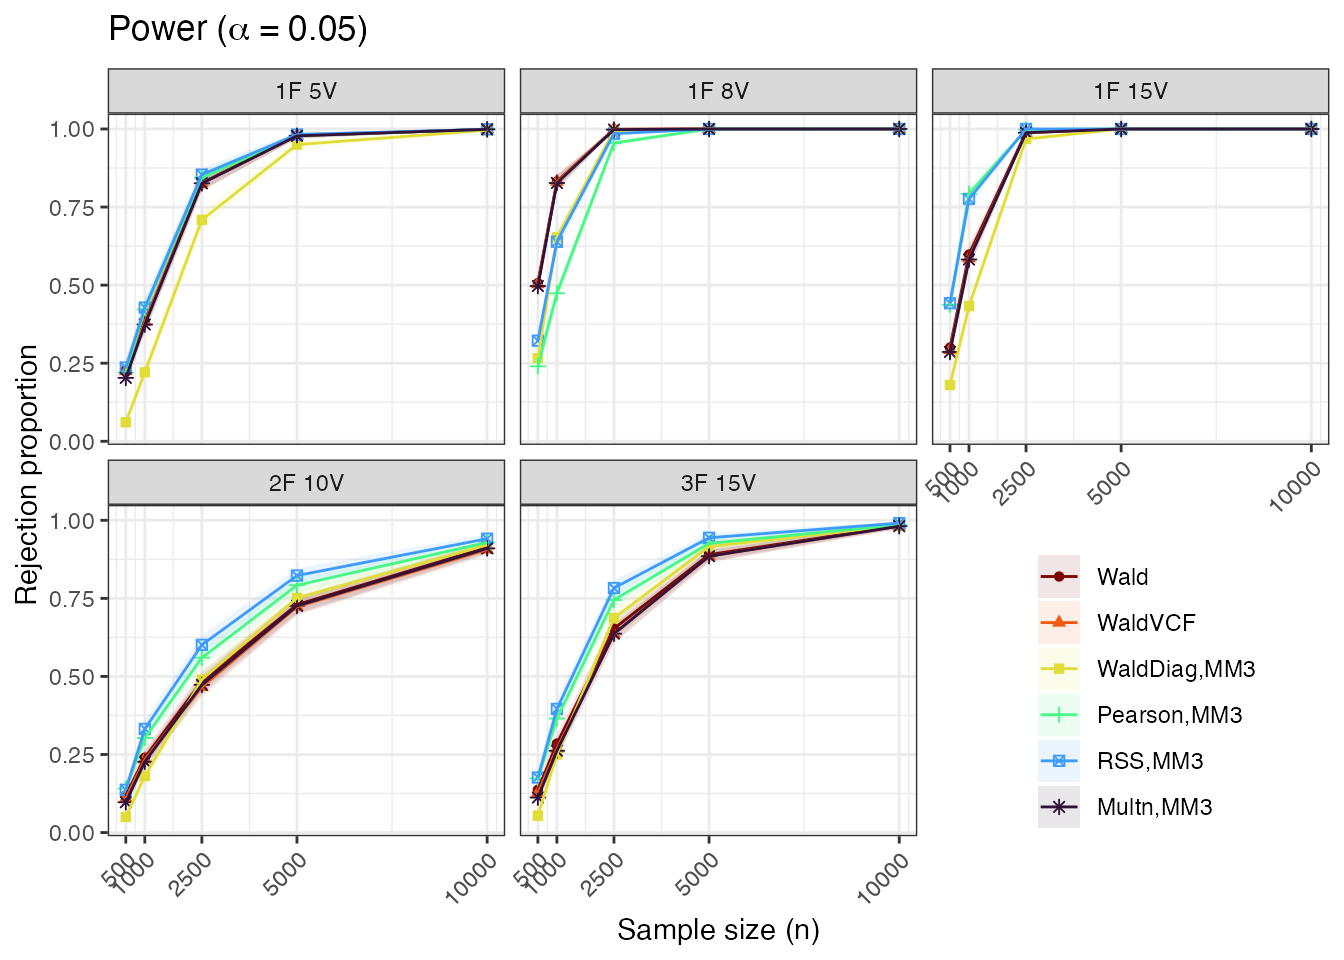
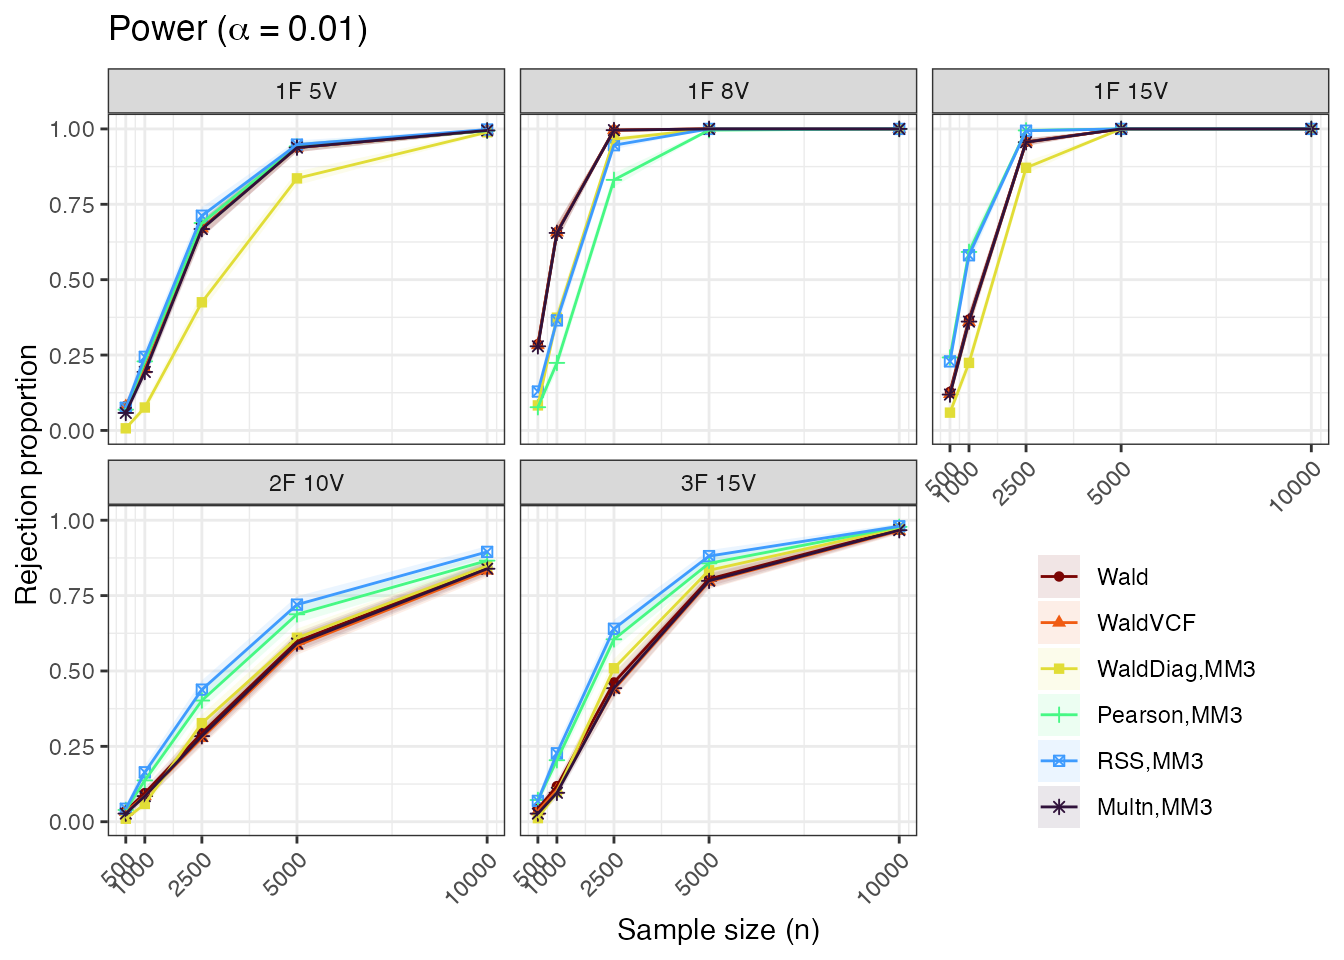
Five scenarios were investigated:
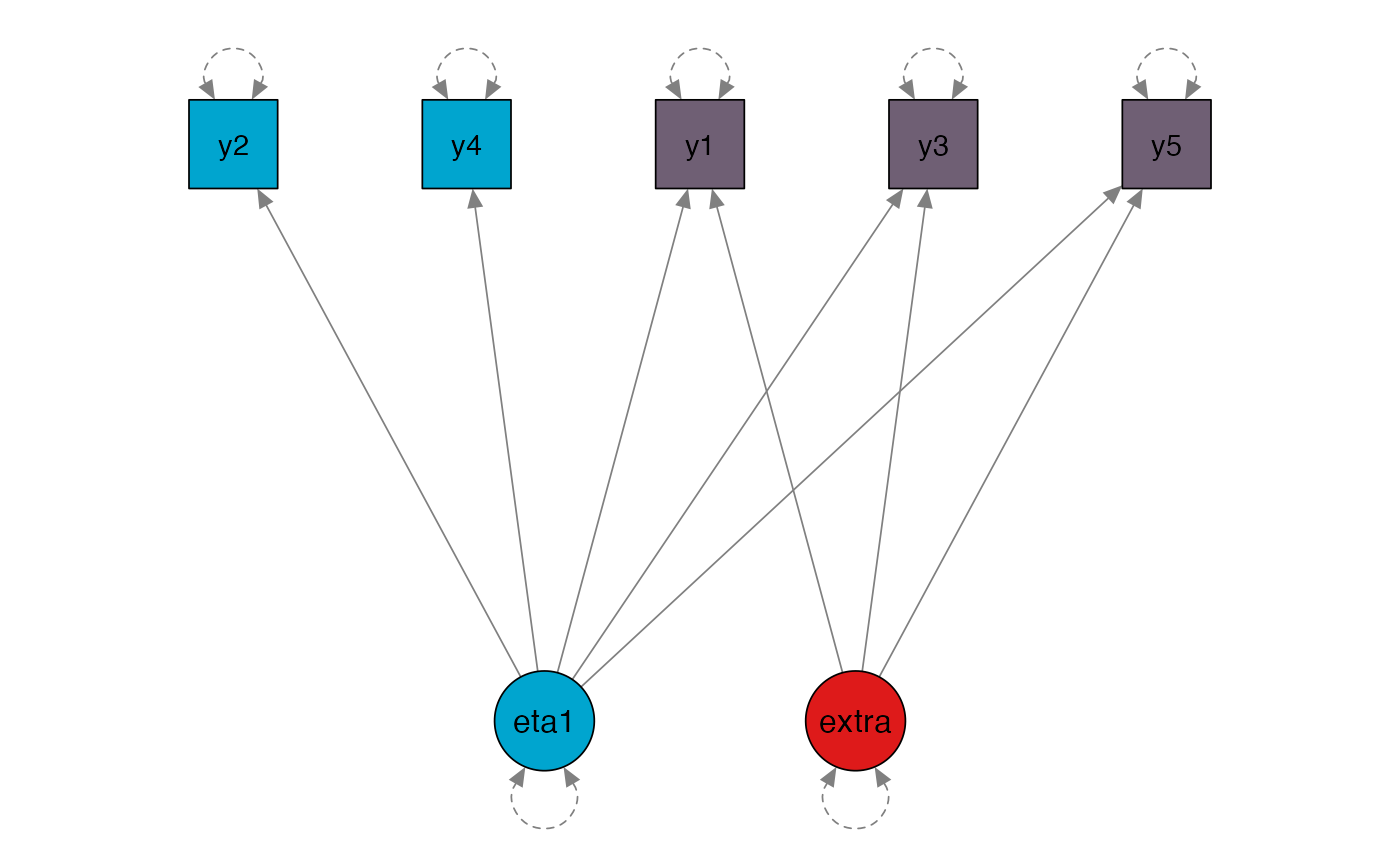
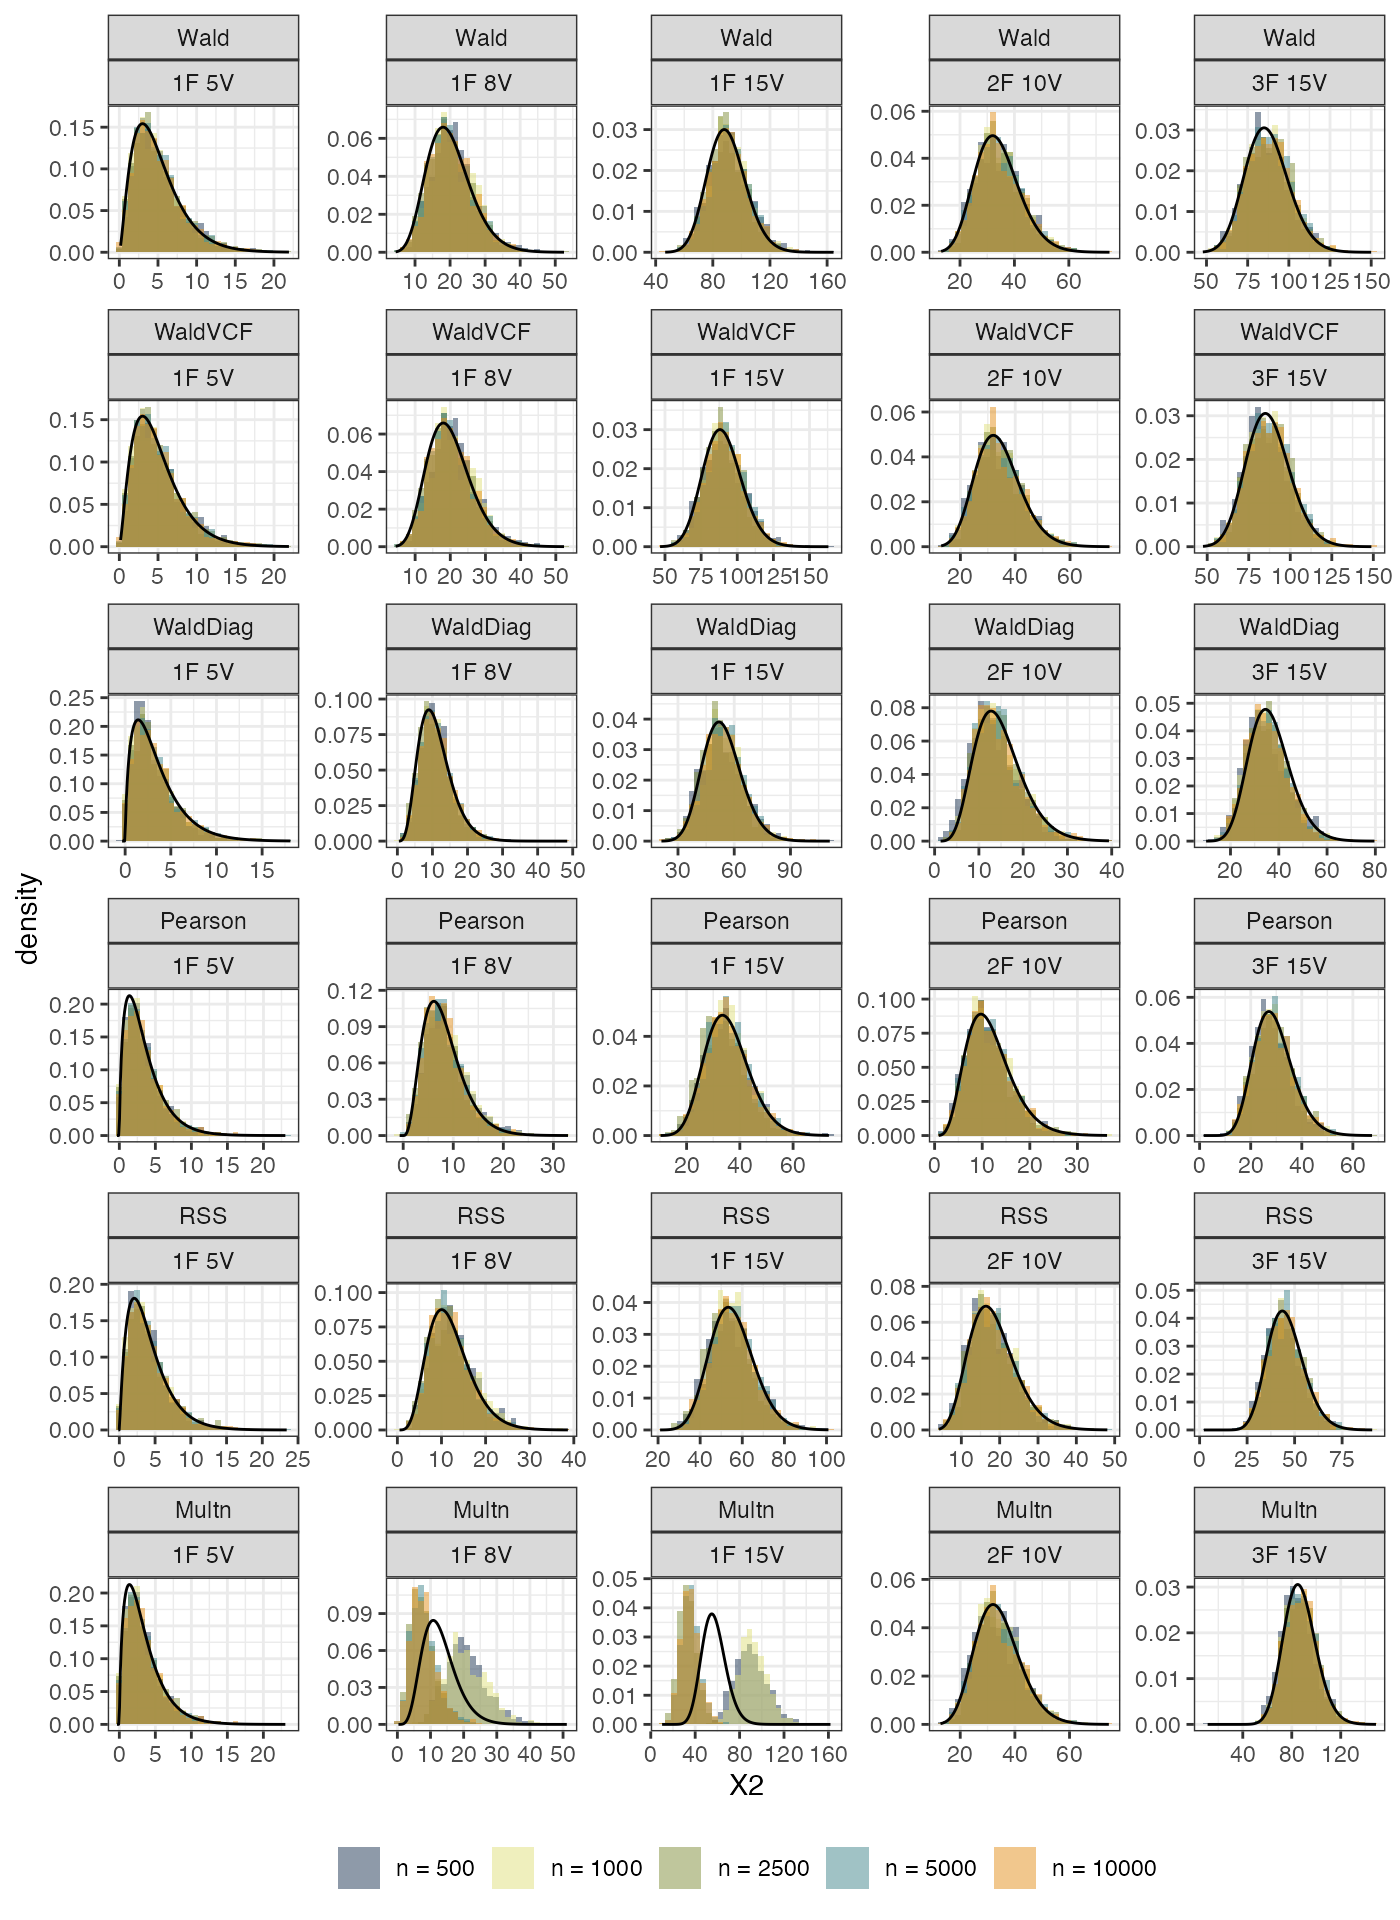
- 1 factor, 5 variables
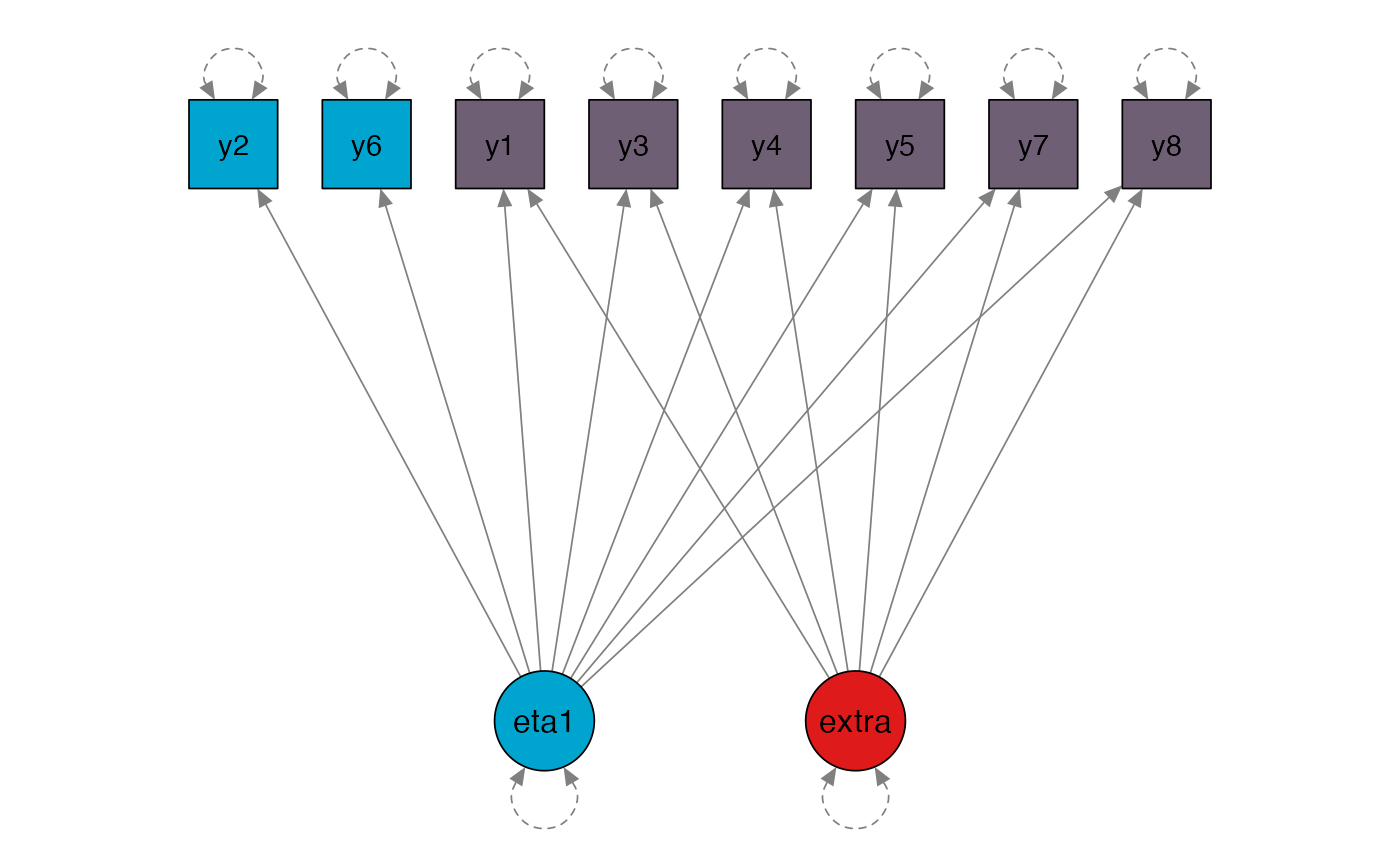
- 1 factor, 8 variables
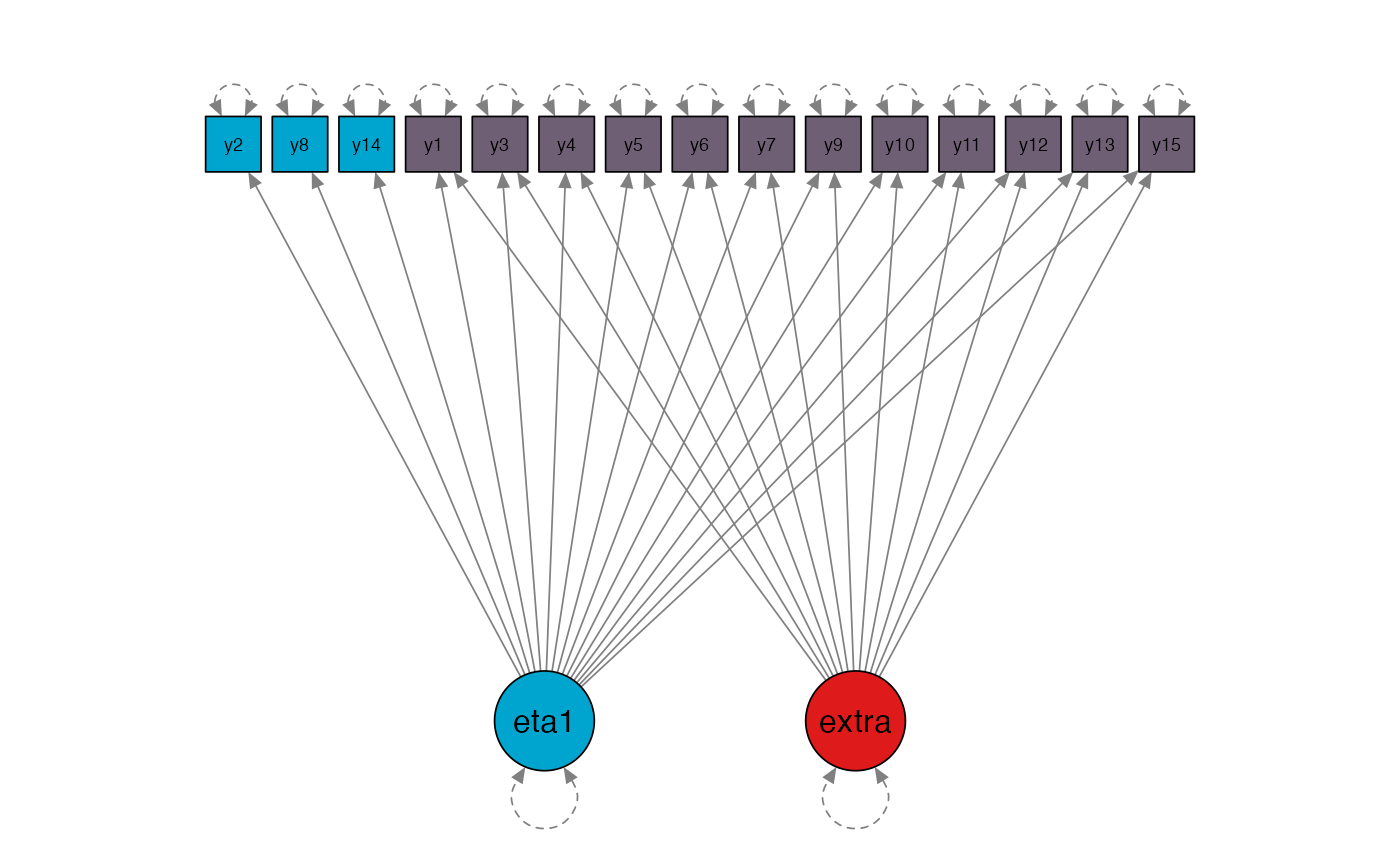
- 1 factor, 15 variables
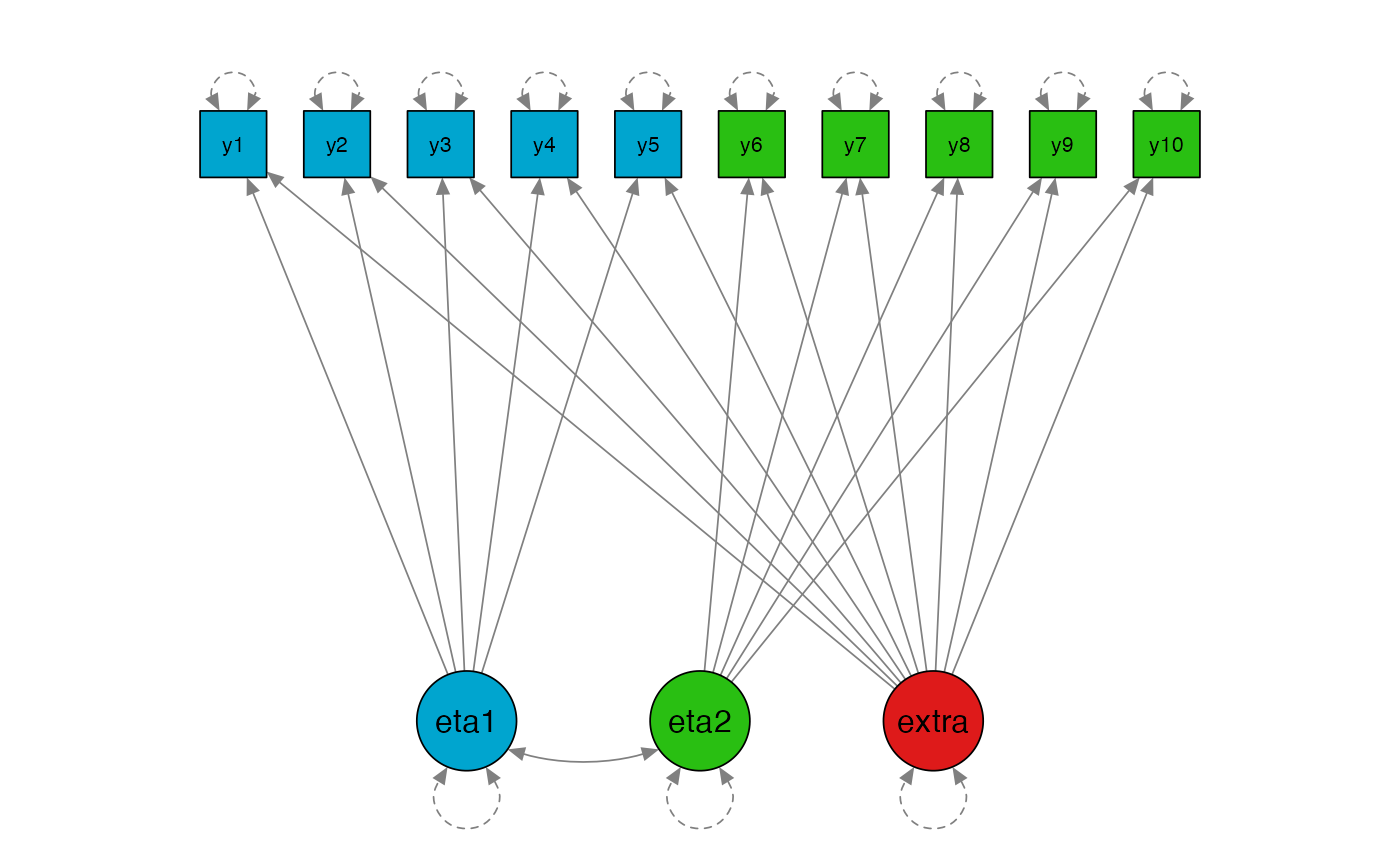
- 2 factor, 10 variables
- 3 factor, 15 variables
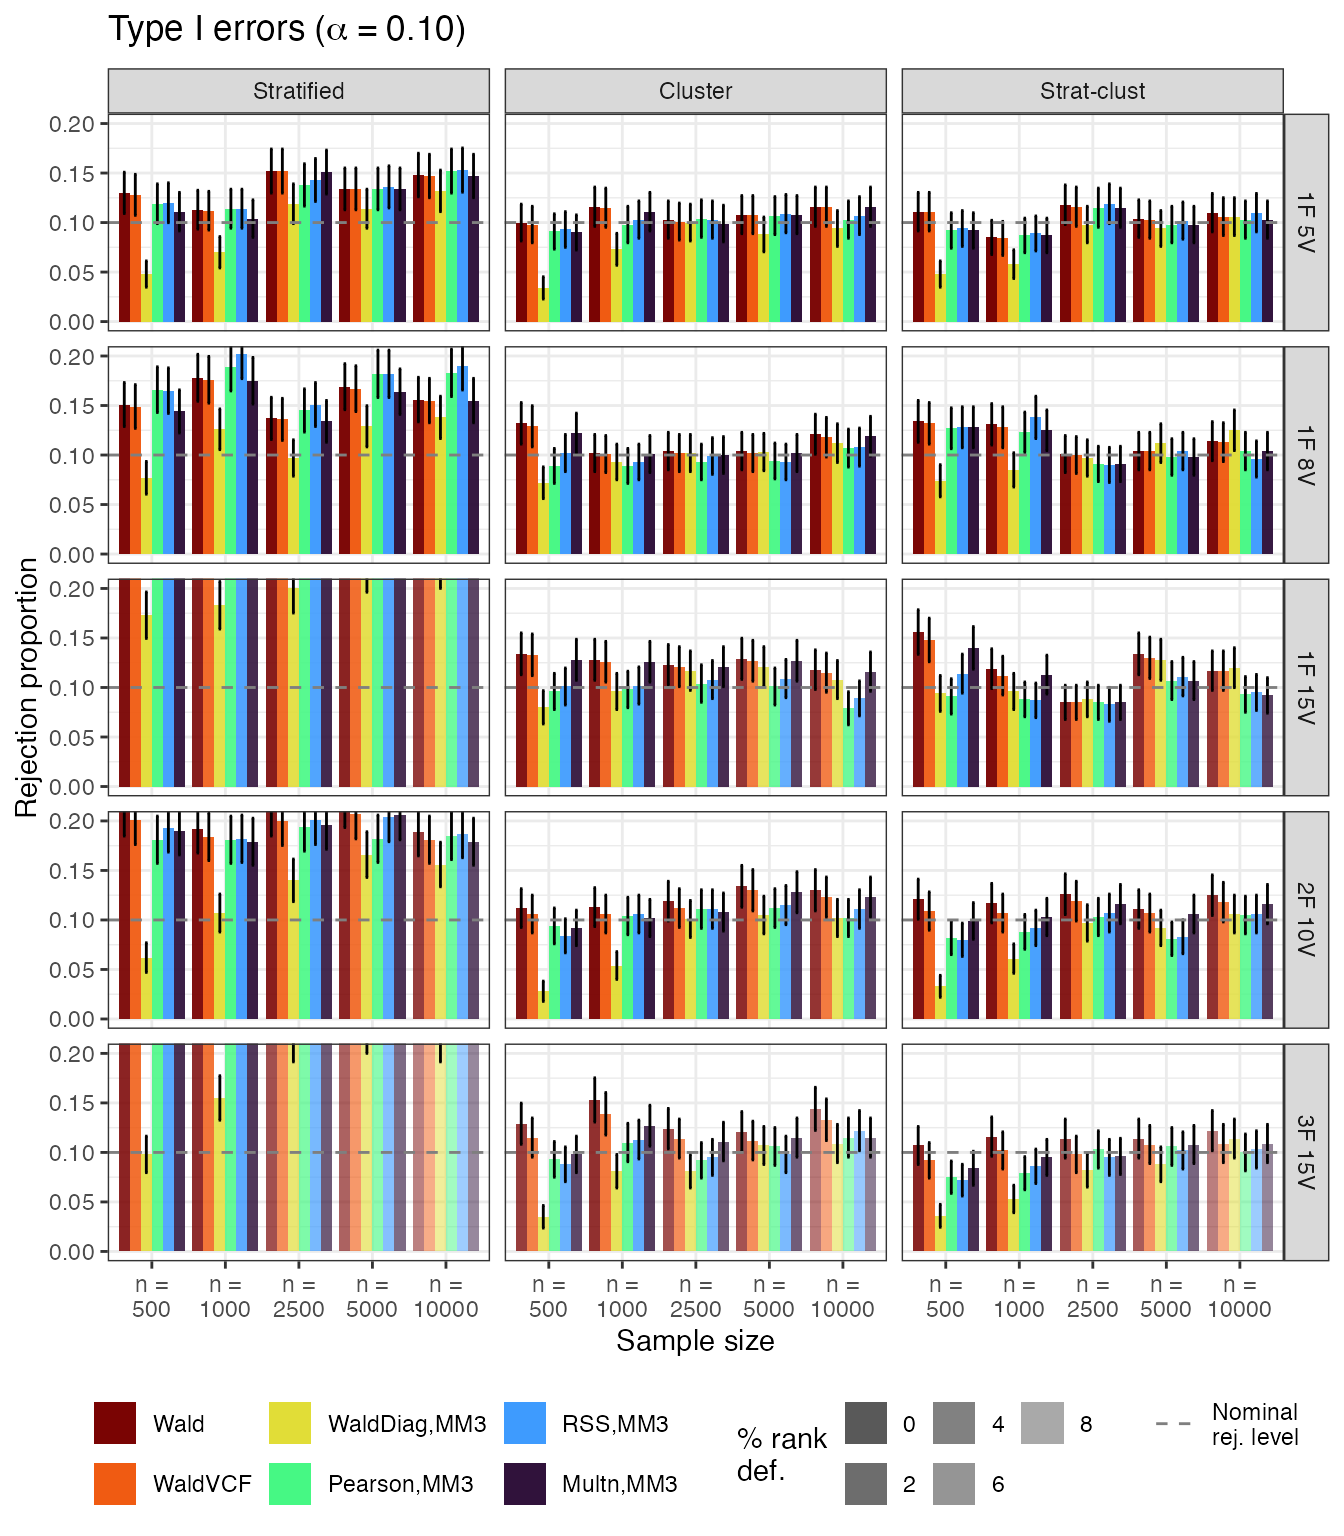
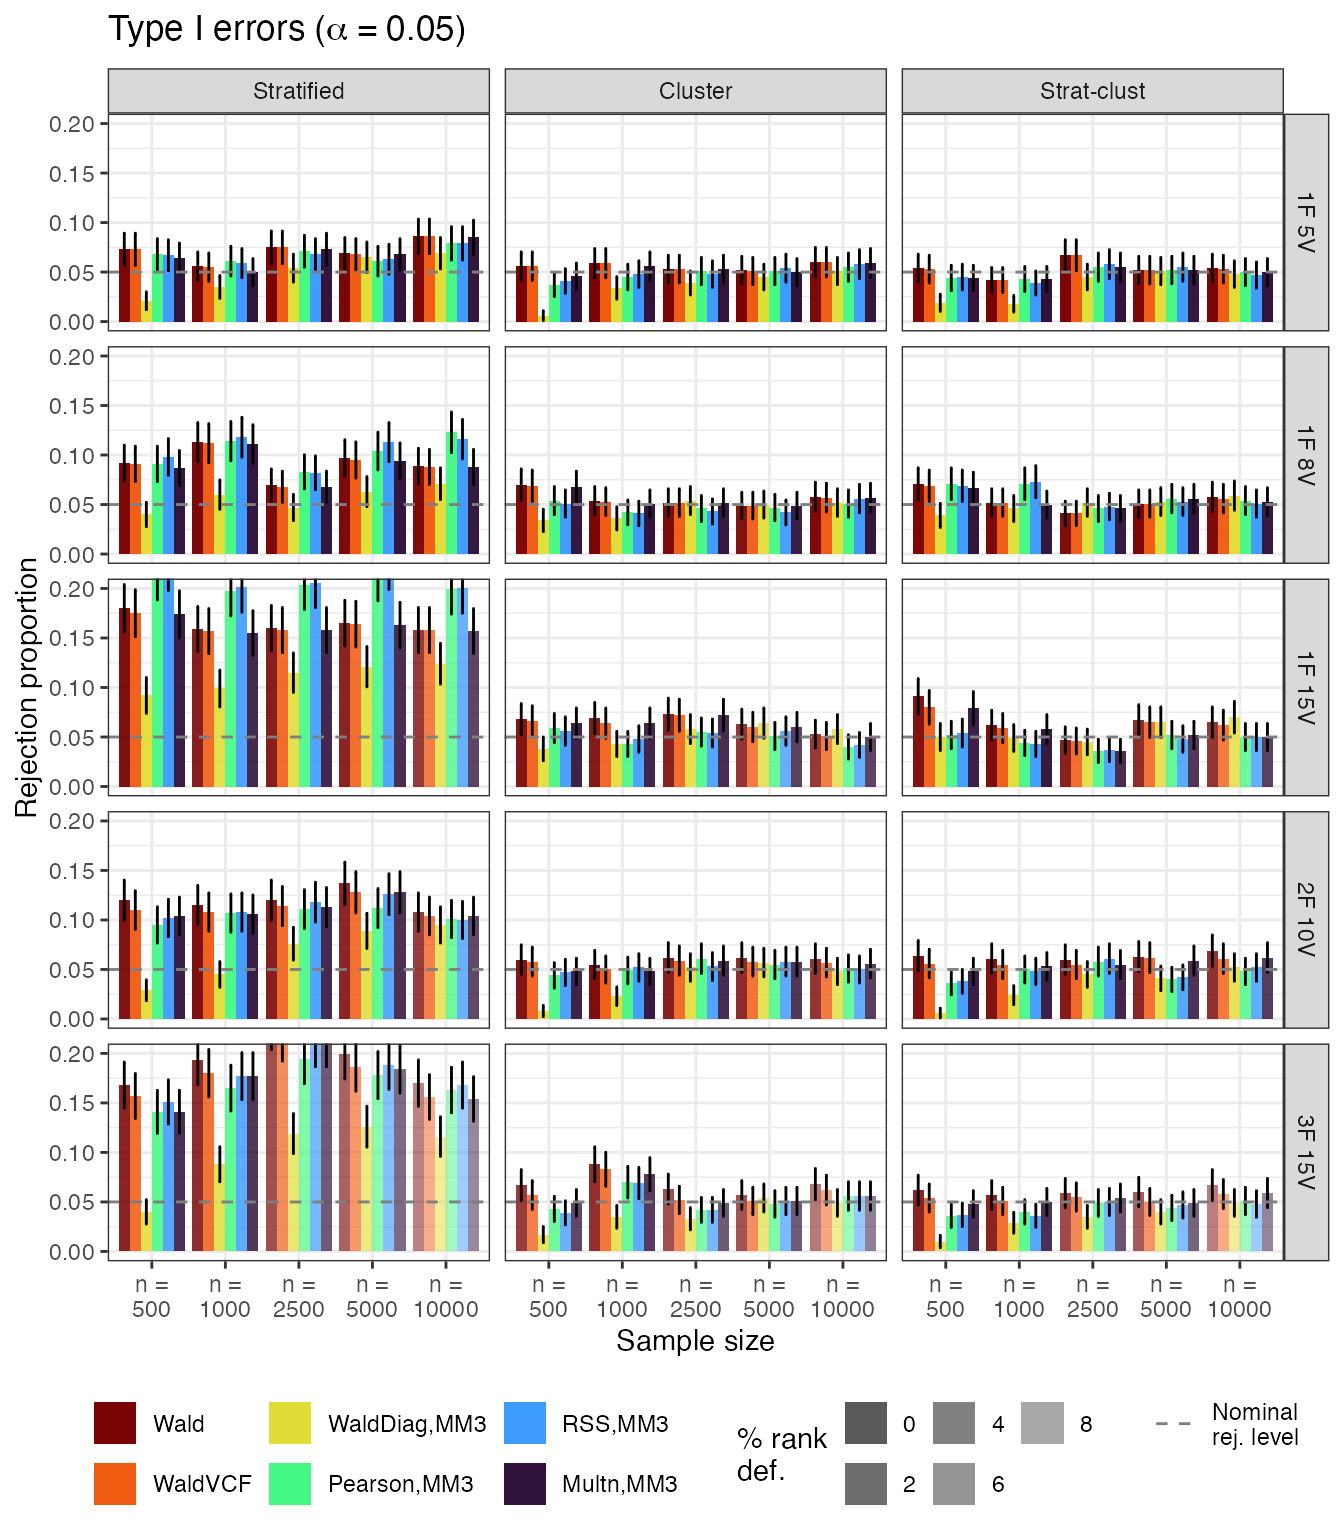
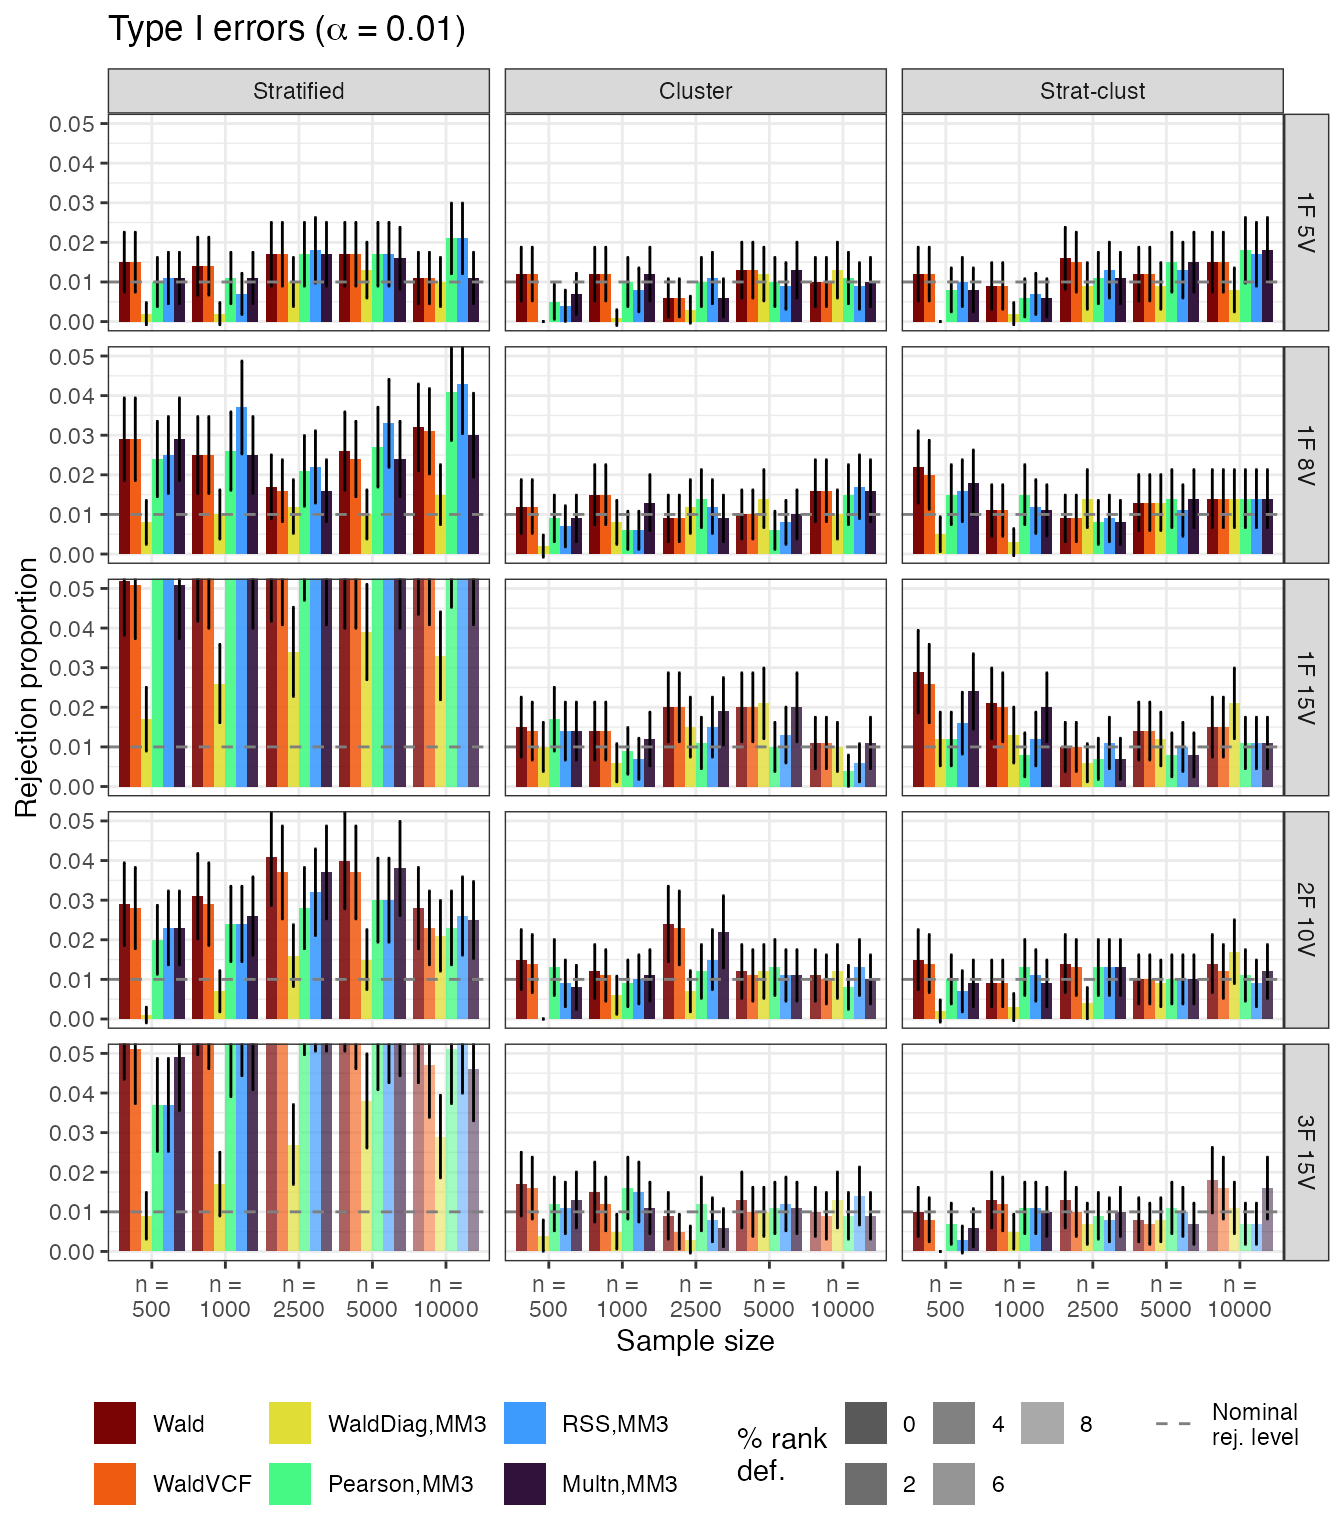
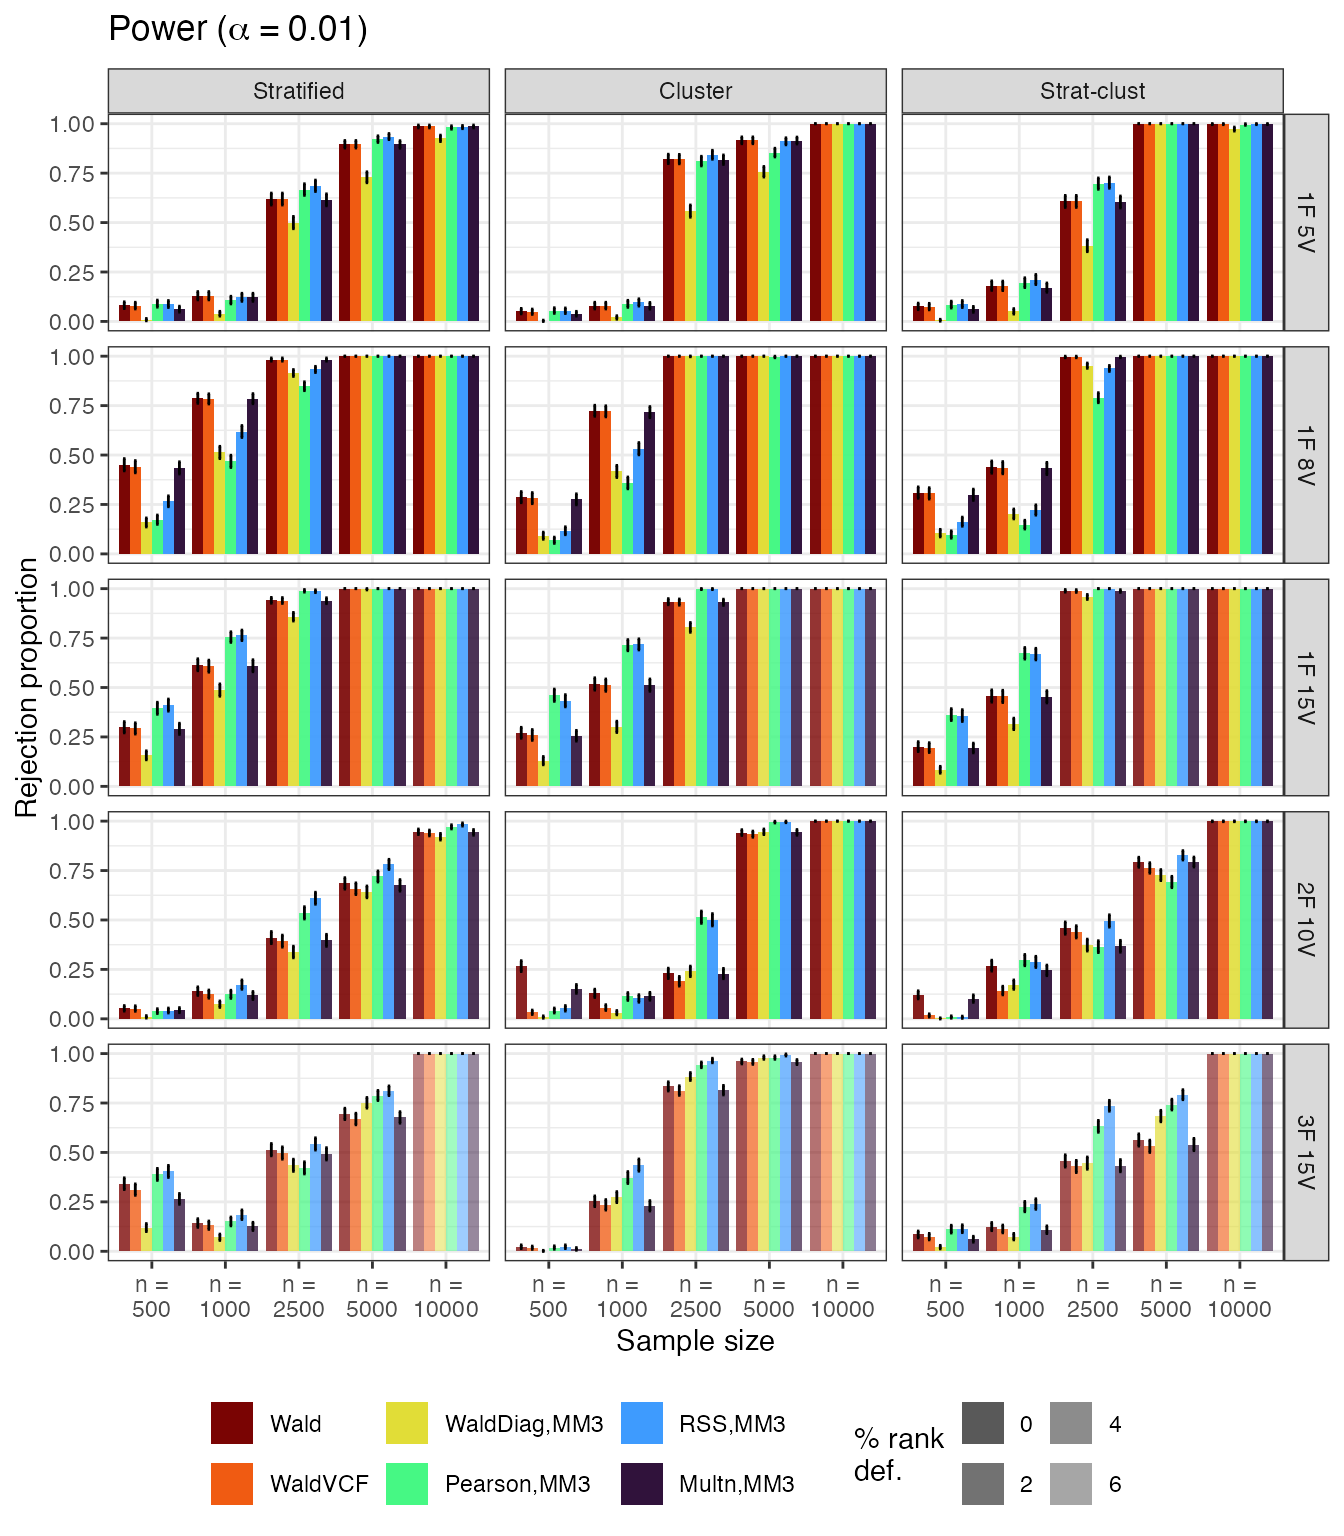
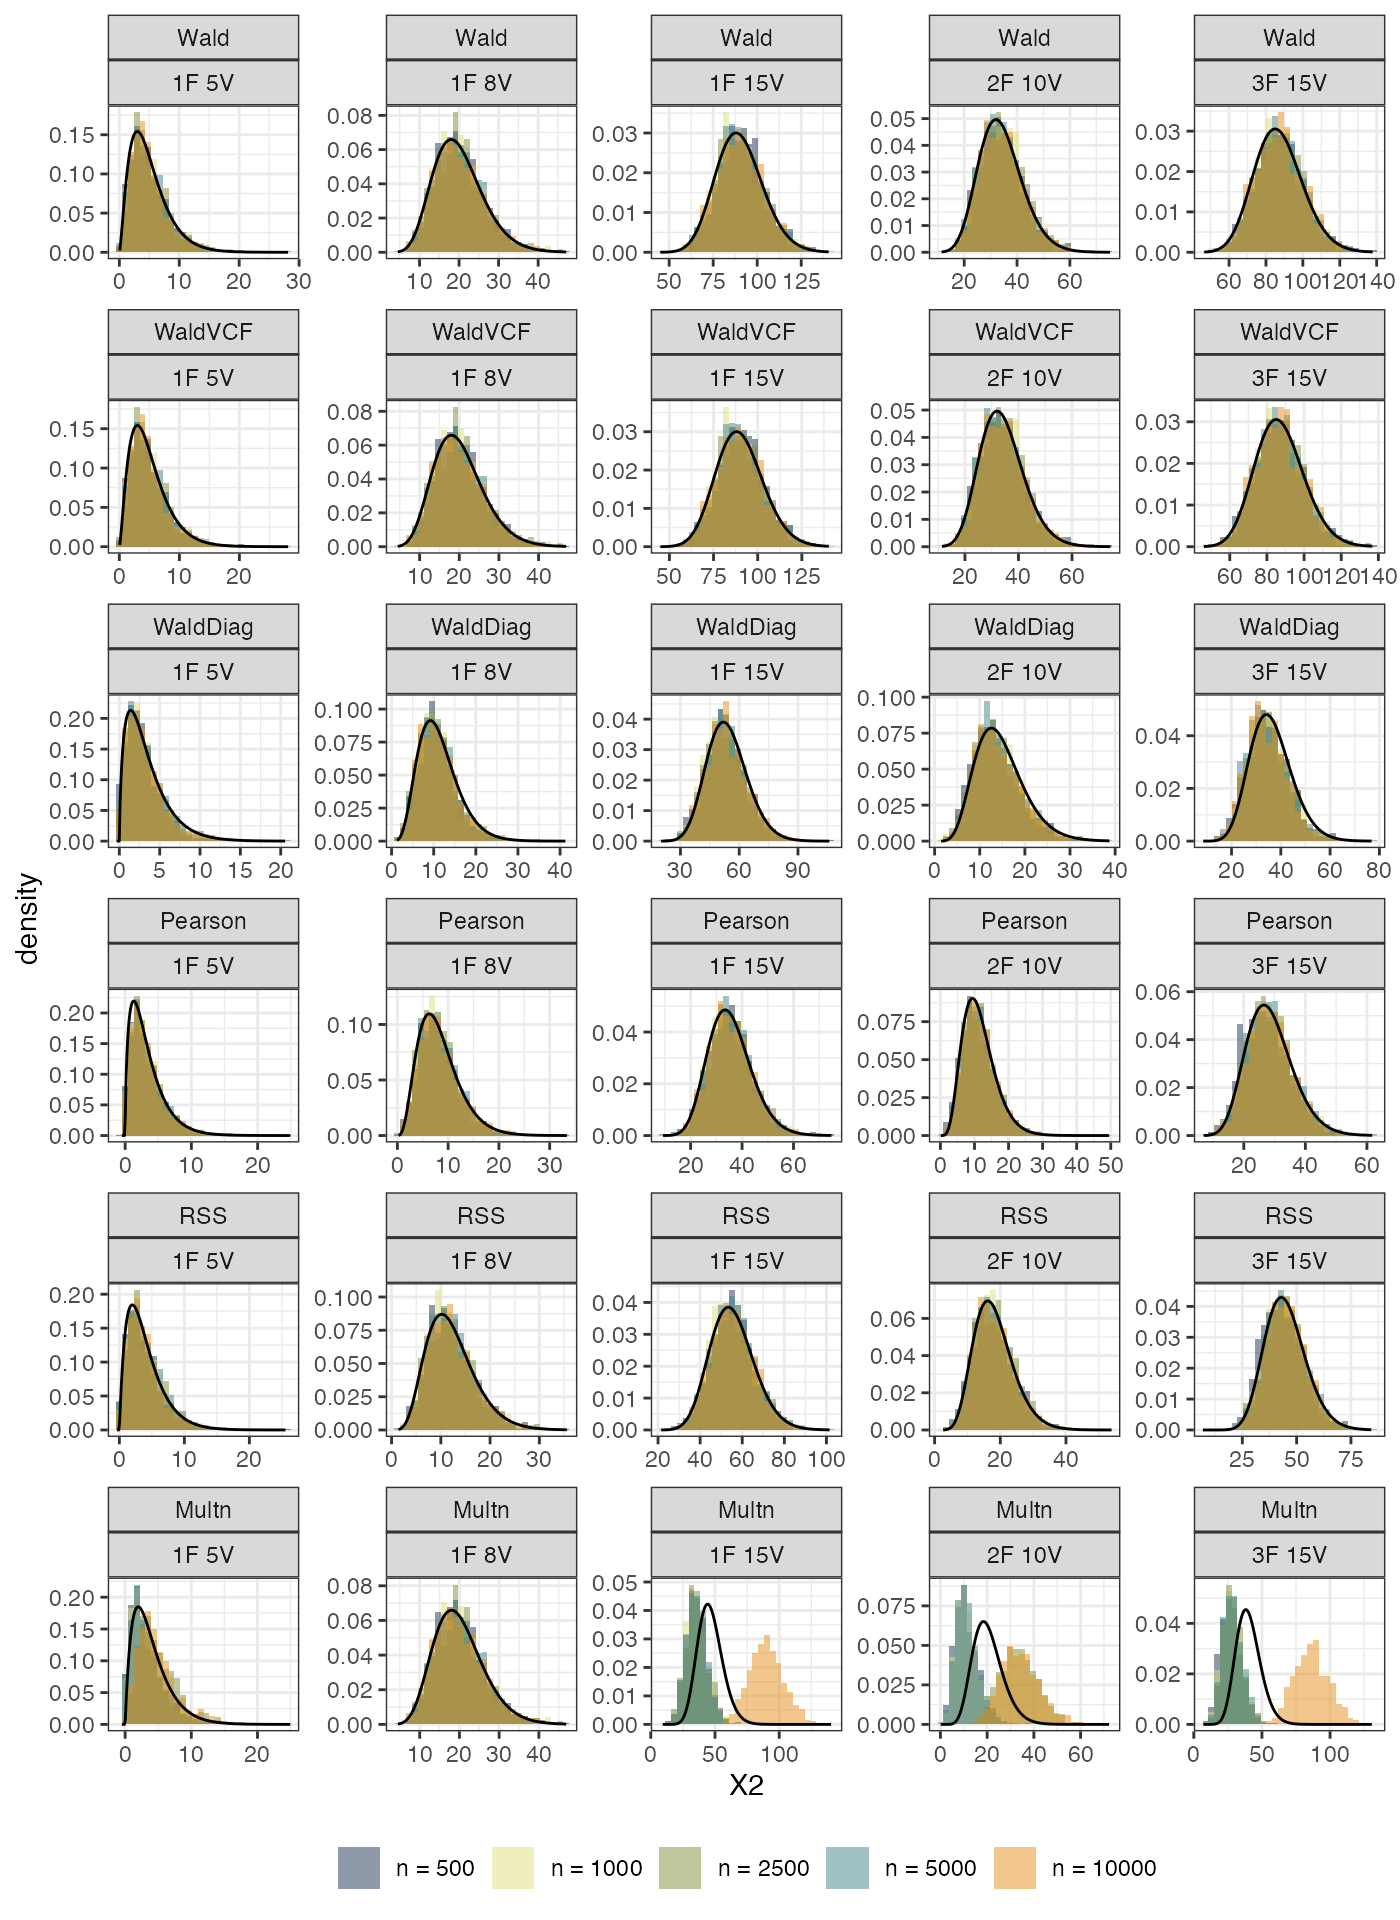
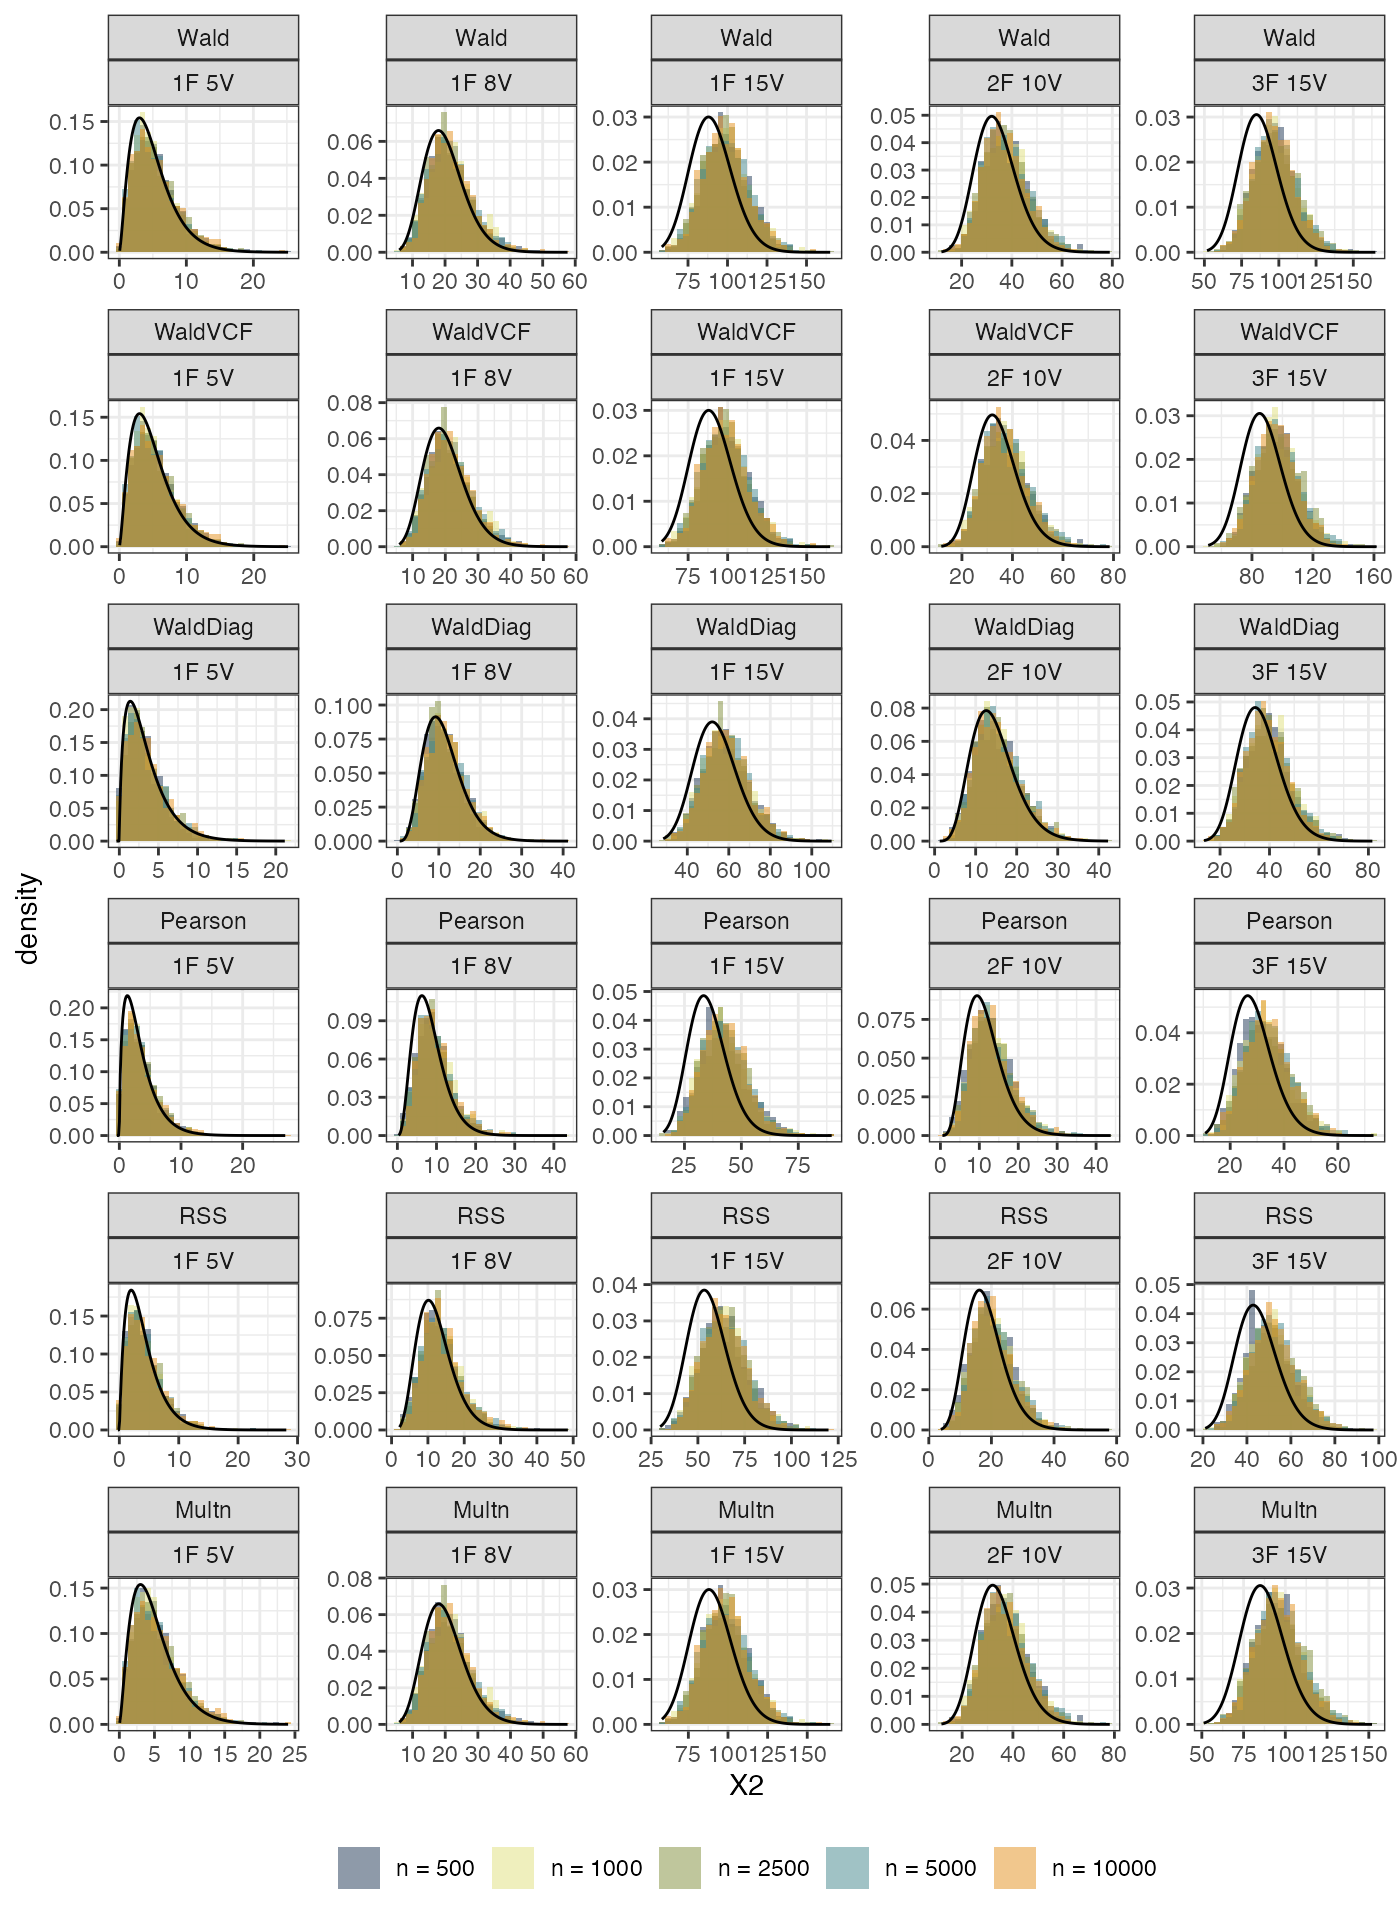
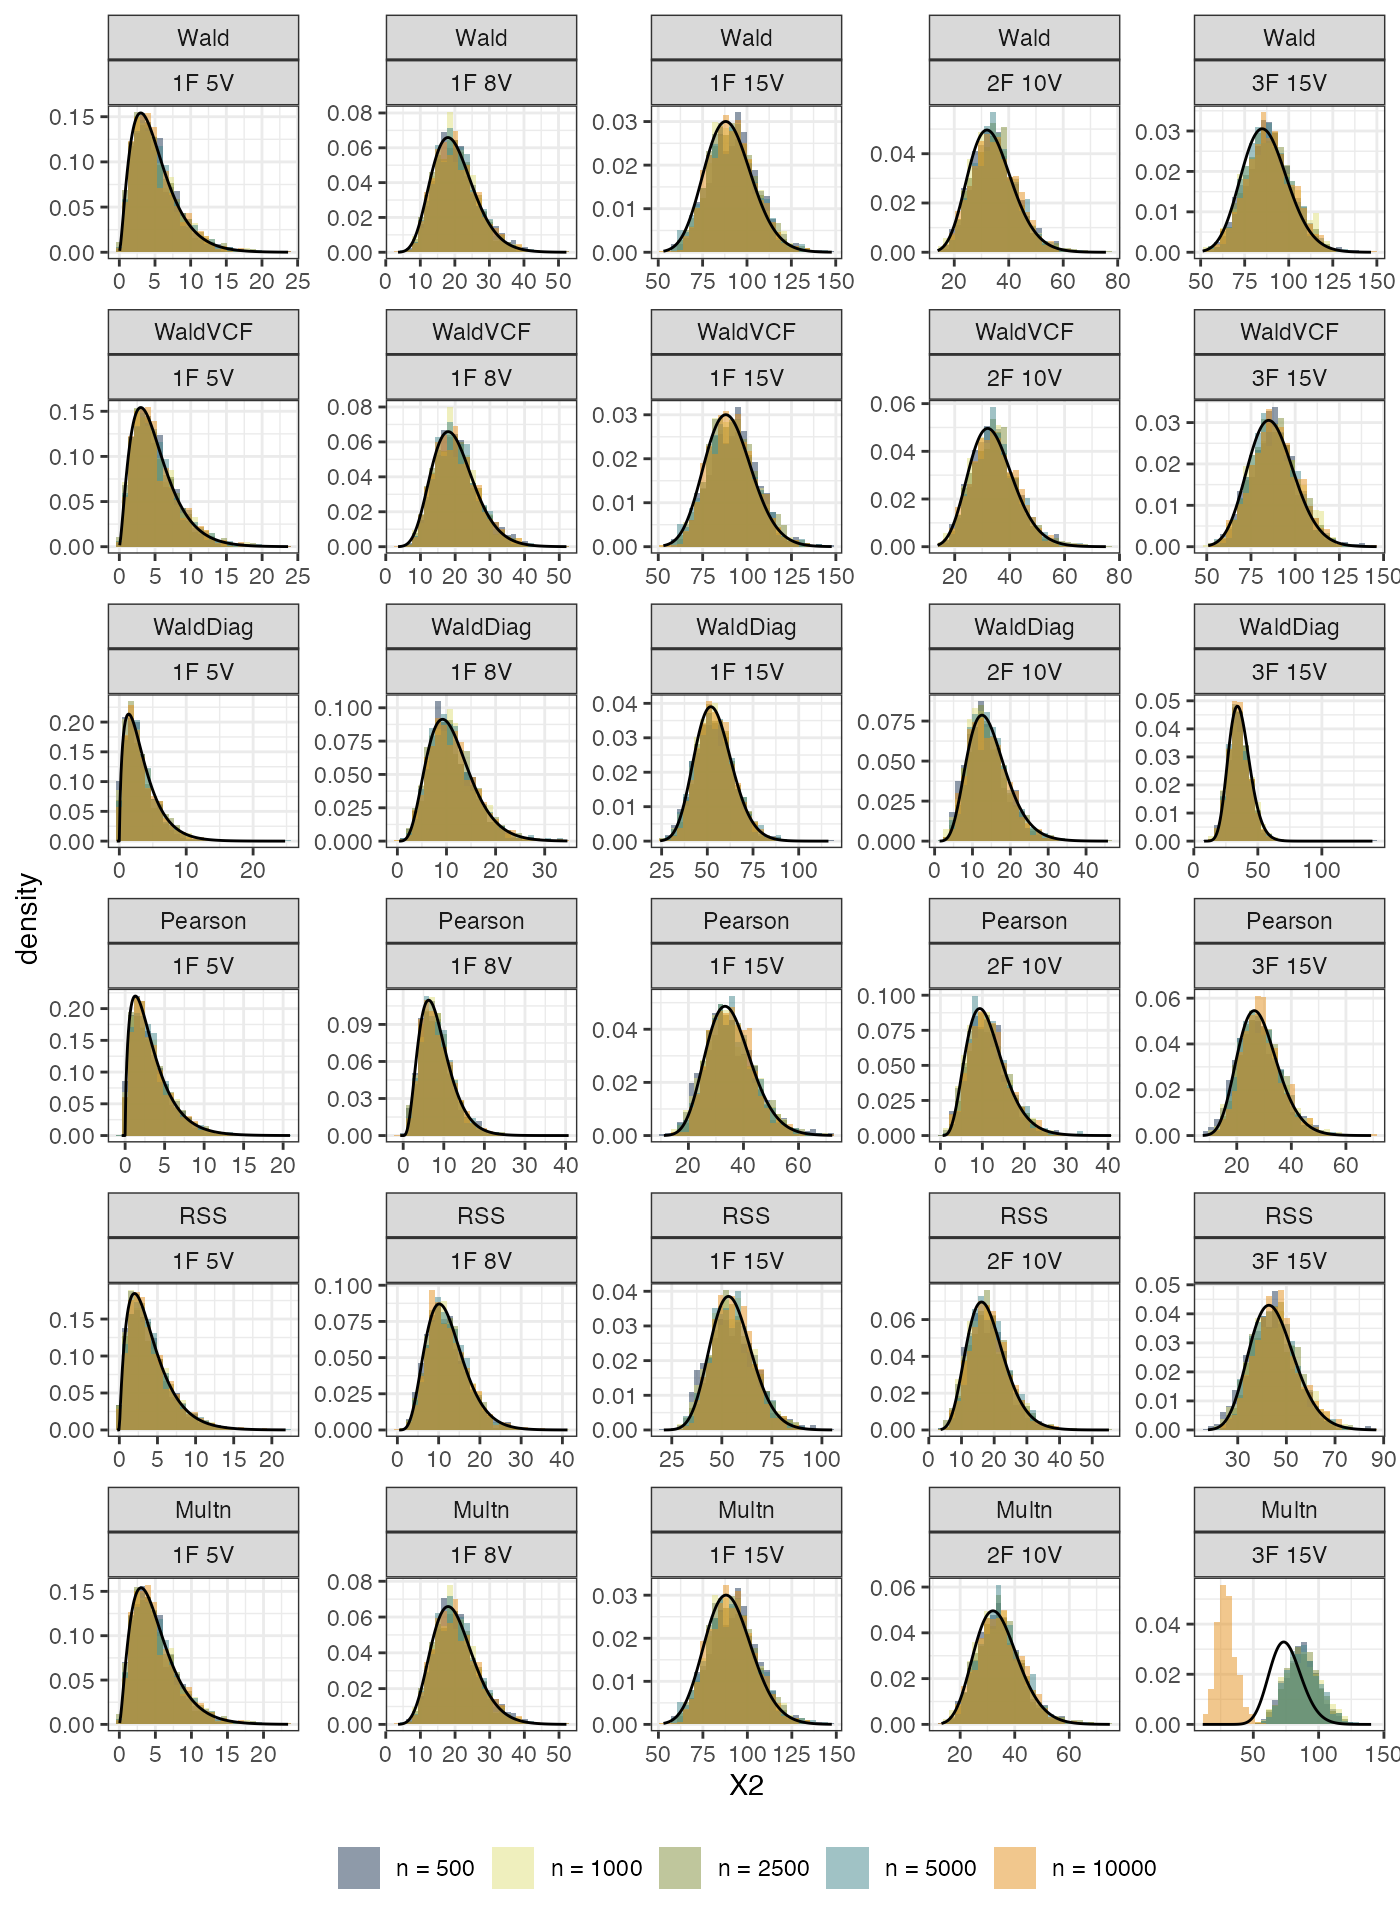
For each scenario, data were generated either according to simple random sample or a complex sampling procedure using true parameter values, and the rejection rate (Type I error) were calculated.
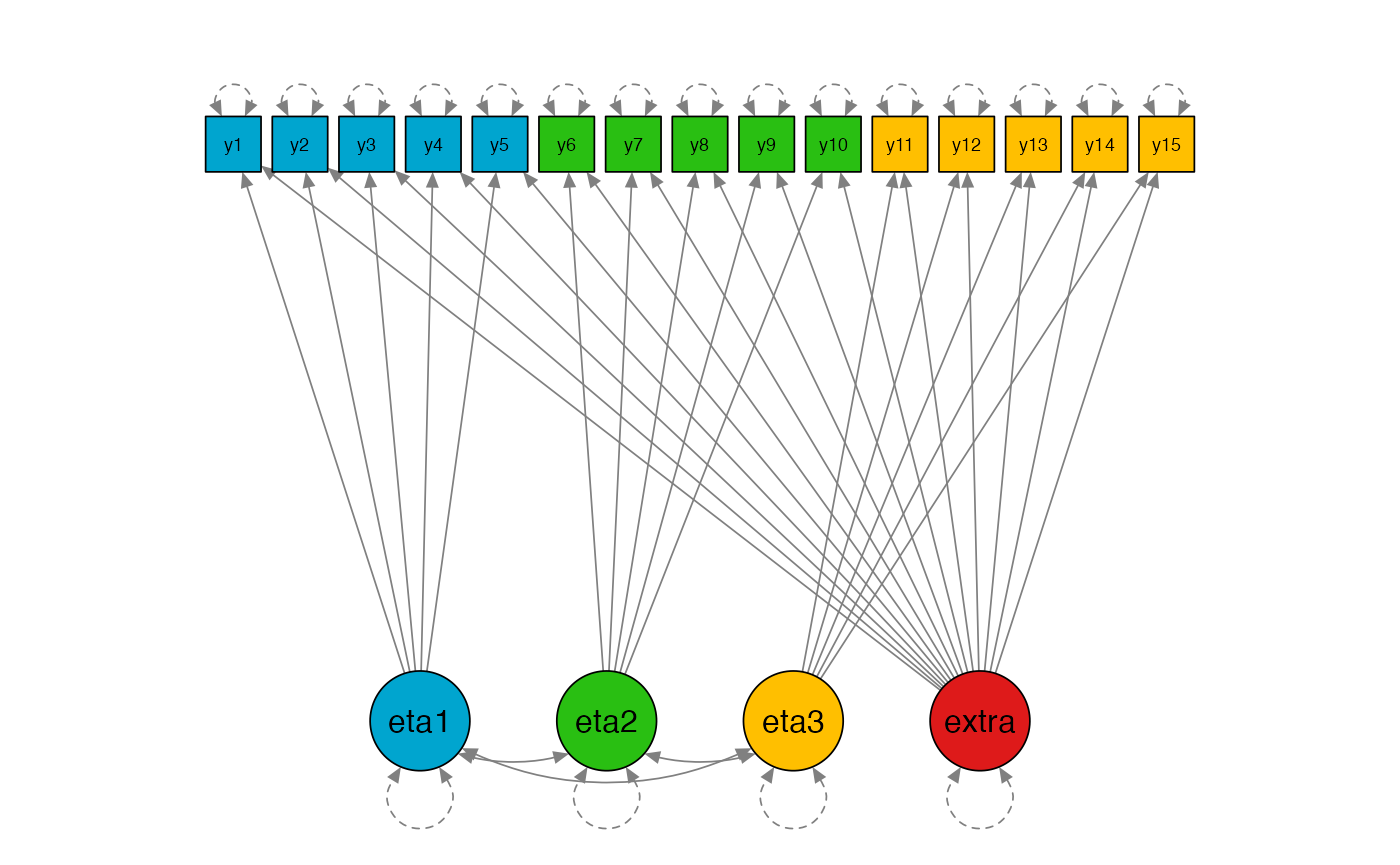
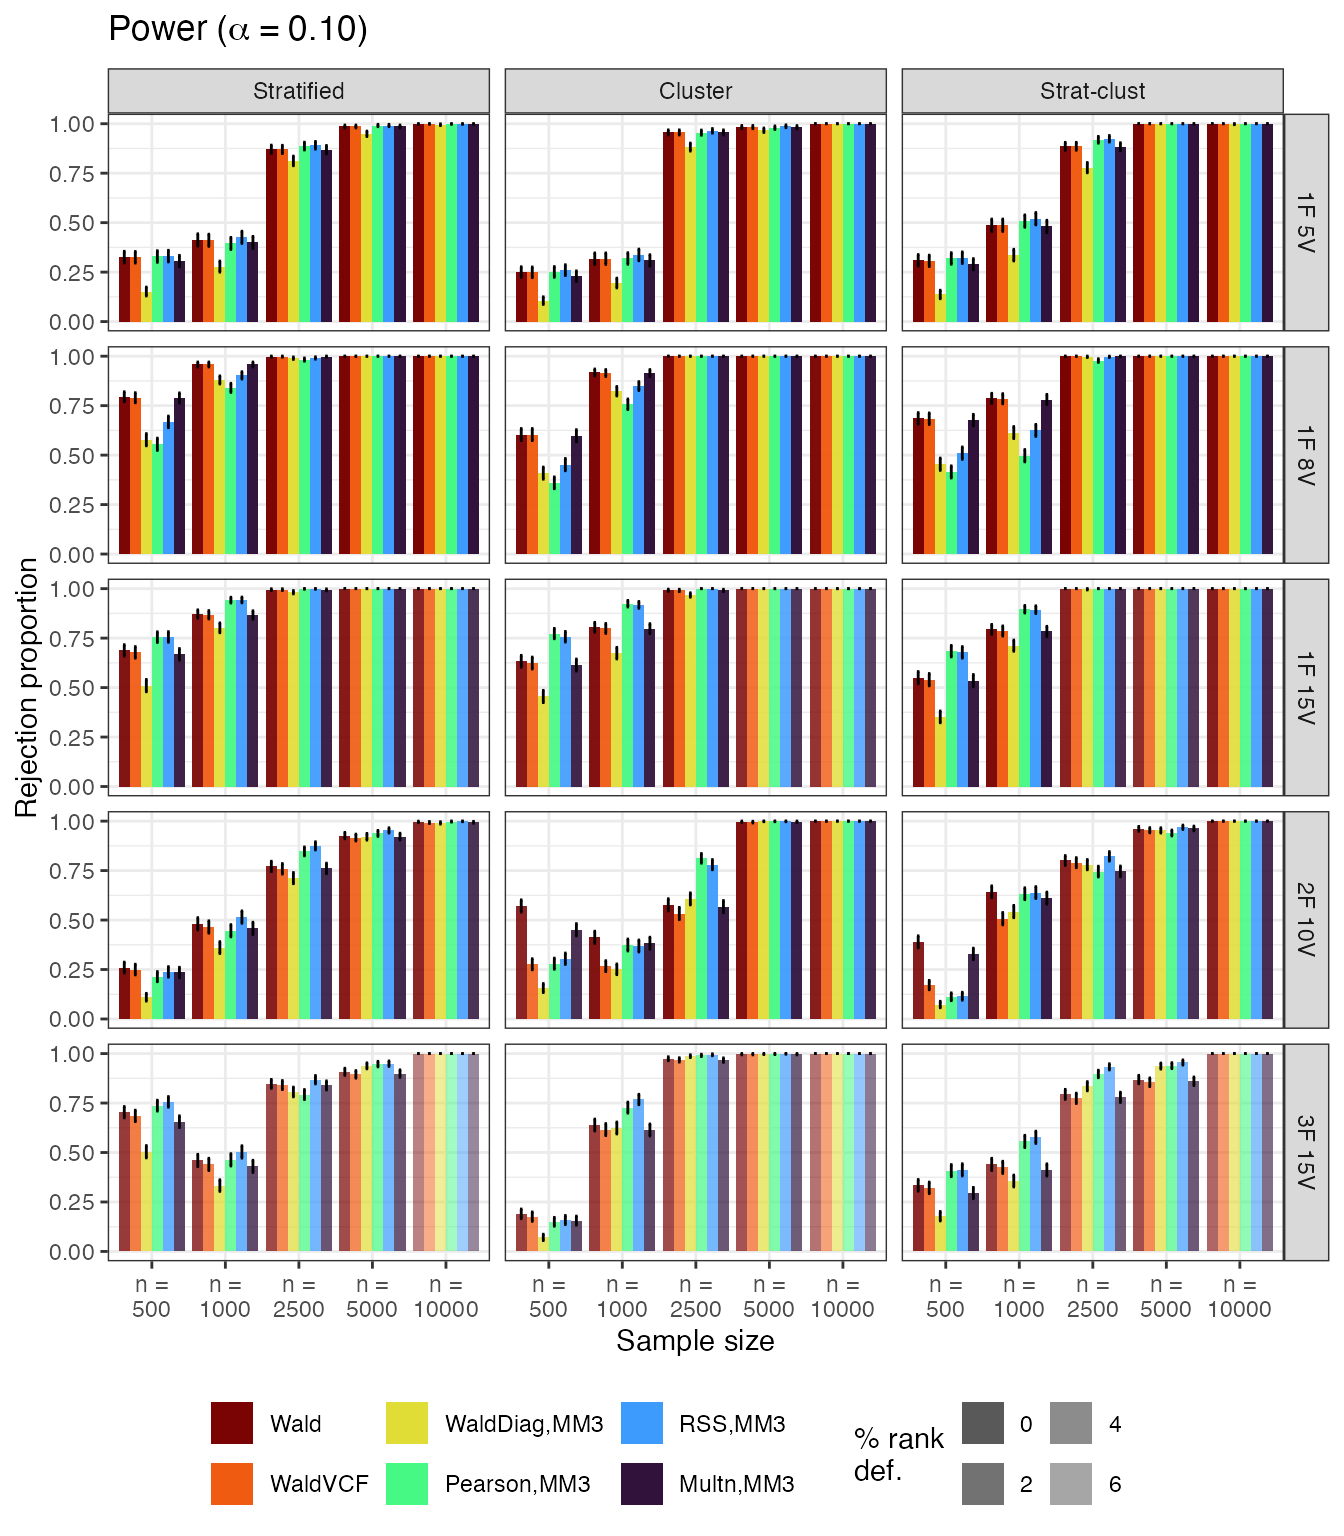
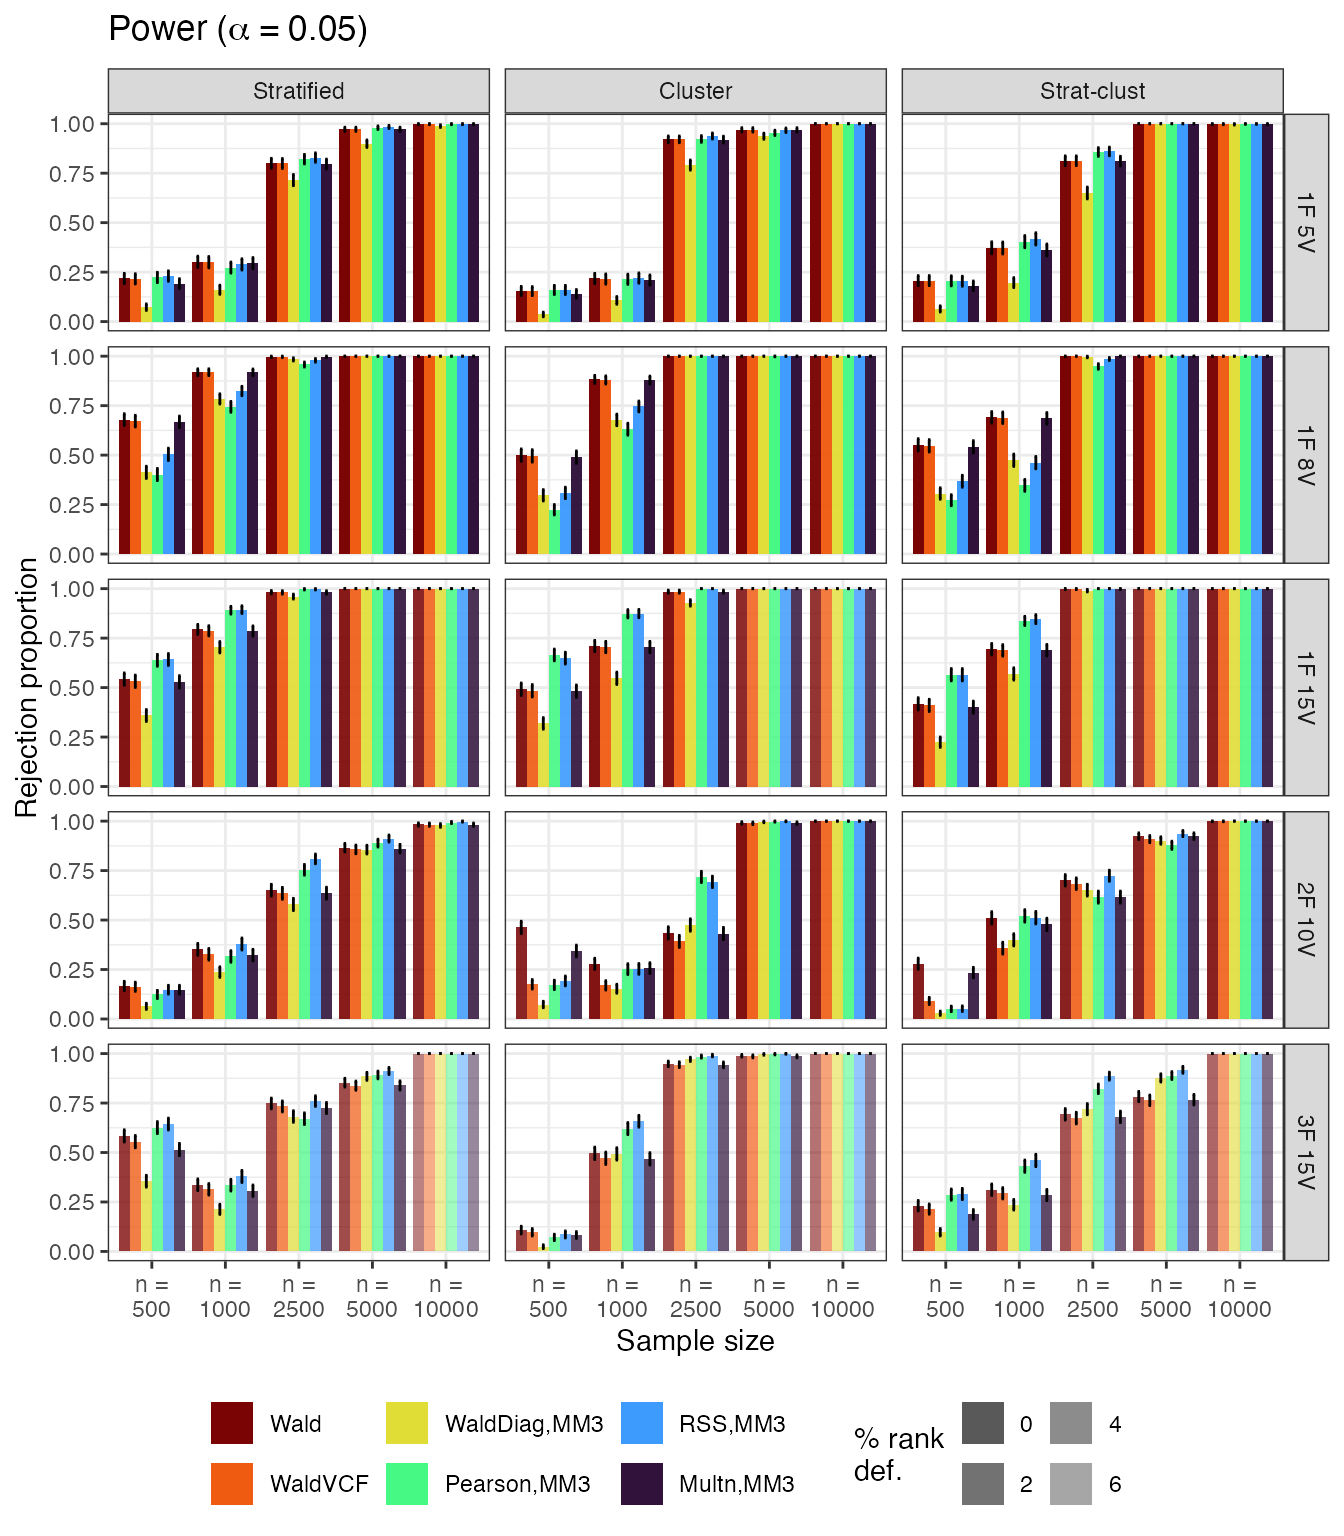
To conduct a power analysis, an extra latent variable independent to the latent factor was added to the variables. The loadings of are similar to the true values except that some noise () was added. This means that the fitted model is misspecified because a missing factor was not accounted for.
The simulations took roughly 20 hours to complete. No convergence issue reported when the sample size is in the range (previous versions of this simulation study saw lavaan having difficulty converging when or –these simulation results are not trustworthy so have been omitted).